| Welcome Guest, please sign in to participate in a discussion. | Search | Active Topics | |
Registered User
Joined: 12/7/2007
Posts: 88
|
I created my own version of T2104 to verify that I could more or less duplicate it and understand it. I wanted to track something quite similar in my own software. I ran it back to 1998 and it mimics T2104 very closely. However, since around early April, there has been a divergence with T2104 not confirming the new highs in the market and my version doing just that. I want to rely on your time proven indicator but it's not working the way it usually does, and it does not match my own version (which does confirm the new highs), all of a sudden. Has the formula been changed at all this year? Would you have any idea why taking Adv Issues * Up Volume less Declining issues * dn volume would suddenly diverge after tracking closely for almost 20 years? Appreciate any ideas you would have. I realize my formula is not the same as the up volume of advancing issues less the down volume of declining issues, but it's been a good proxy for a long time, until now. Thank you.
|
|

Registered User
Joined: 6/30/2017
Posts: 1,227
|
Thought this sounded familiar. SImilar question posted in another forum. SInce it's received no replies in either location, I'm buping it to the top to see if it gets some love. :)
|
|

Registered User
Joined: 6/30/2017
Posts: 1,227
|
buping = bumping. LOL.
|
|

Registered User
Joined: 6/30/2017
Posts: 1,227
|
Nudging it back to the top. Not my question; just noticed it's been hanging since Friday...
|
|


Worden Trainer
Joined: 10/7/2004
Posts: 65,138
|
I submitted the question to data right after it was posted.
-Bruce
Personal Criteria Formulas
TC2000 Support Articles
|
|

Registered User
Joined: 6/30/2017
Posts: 1,227
|
Oops. My bad. Never doubted you, Bruce. Carry on :)
|
|

Administration
Joined: 9/30/2004
Posts: 9,187
|
Nothing has changed in the way T2104 is calculated.
|
|

Administration
Joined: 9/30/2004
Posts: 9,187
|
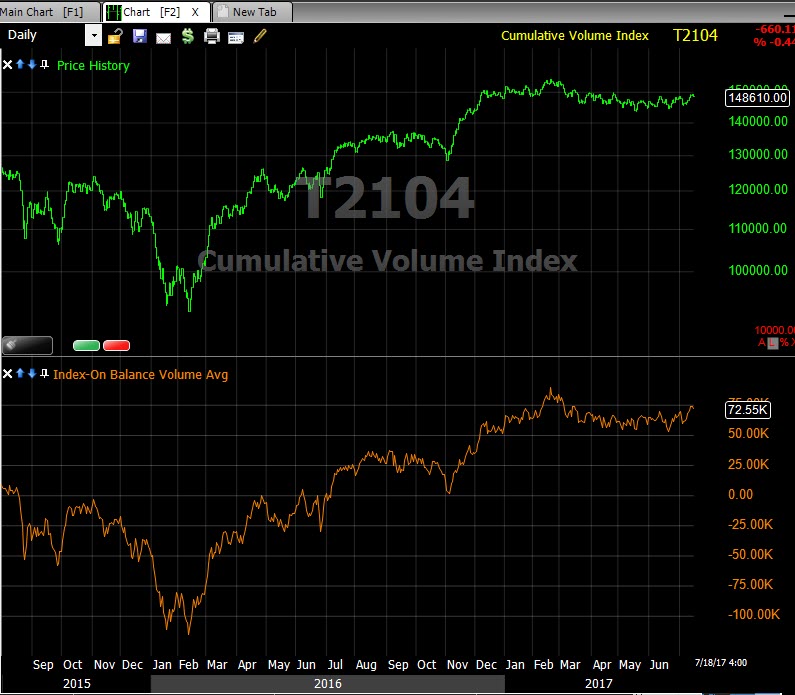
Bruce created a market index of On Balance Volume for NYSE stocks over the last two years and the shape closely matches the pattern of T2104.

Attachments:
T2104Test.jpg - 104 KB, downloaded 1,113 time(s).
|
|
|
Guest-1 |