| Welcome Guest, please sign in to participate in a discussion. | Search | Active Topics | |
Registered User
Joined: 12/2/2004
Posts: 1,775
|
Just logged on to TC2000 v12 for first time in quite a few months. I would like for the charts to match as closely as possible to what I use in Telechart v7. v7 has a set 11 grid lines, but v12 shows twice as many or more. That's a BIG problem for me as I only use logarithmic with percentages between grid lines showing. Is there a way to lower the number of grid lines in v12 to 11 (eleven)? Doing so should make the charts' percentages between grid lines more closely match what I currently see in v7 Telechart. Thank you.
|
|
Registered User
Joined: 12/2/2004
Posts: 1,775
|
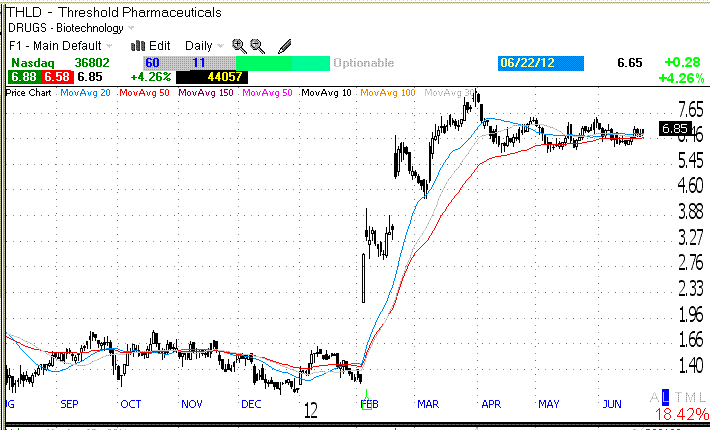
A picture simplifies. This example from v7 shows grid line percentage of 18.42% at zoom 3 setting. Can anyone duplicate in v12? I understand that it may be impossible for both versions to show the exact same number of days, so the exact percentage may not be possible, but a percentage not off by more than one (+/-) would be acceptable. Thanks.

|
|


Worden Trainer
Joined: 10/7/2004
Posts: 65,138
|
If you right-click on the value scale along the right hand side of the price chart, there are options to increase grid spacing and decrease grid spacing. You will probably need to select increase grid spacing multiple times to get the grid lines as wide apart as you would like.
-Bruce
Personal Criteria Formulas
TC2000 Support Articles
|
|
Registered User
Joined: 12/2/2004
Posts: 1,775
|
Thank you Bruce for tip. I tried it and was able to show 11 grid lines but only for some symbols. Others would not display 11, only 10 or 12, but an improvement.
But I'm unable to retain that setting. EVery time I hit J and go to another symbol/chart, the chart reverts back to approx 22 grid lines and the percentage icon reverts back to log. And this is AFTER I saved the chart as my main default by clicking the floppy disk save icon top right. Also, when I hit F1 it reverts back to 22 grid lines. I then repeat the process and I'm never able to save my chart so it will always display the way I customize it. I even tried saving layout and desktop, but confused on how to save my chart as main defaut, F1, just as I do with no problem with version 7. Thanks again.
|
|


Worden Trainer
Joined: 10/7/2004
Posts: 65,138
|
The exact number of lines do fluctuate for my from symbol to symbol.
I am unable to reproduce the issue where the chart reverts back to 22 grid lines and the percentage icon reverts back to log when switching symbols however.
You can set the function key assignments for Chart Templates by clicking on the Charts icon along the left hand side to bring up the list of available Chart Templates. There will be a small white down arrow to the right of each Chart Template name. Clicking on this arrow will allow you to assign the function key. Once a function key has been assigned to a specific Chart Template it will be displayed to the left of the down arrow.
-Bruce
Personal Criteria Formulas
TC2000 Support Articles
|
|
Registered User
Joined: 12/2/2004
Posts: 1,775
|
QUOTE (Bruce_L)
The exact number of lines do fluctuate for my from symbol to symbol.
I am unable to reproduce the issue where the chart reverts back to 22 grid lines and the percentage icon reverts back to log when switching symbols however.
You can set the function key assignments for Chart Templates by clicking on the Charts icon along the left hand side to bring up the list of available Chart Templates. There will be a small white down arrow to the right of each Chart Template name. Clicking on this arrow will allow you to assign the function key. Once a function key has been assigned to a specific Chart Template it will be displayed to the left of the down arrow.
Yes, that worked Bruce, thank you very much.
|
|
Registered User
Joined: 8/27/2007
Posts: 19
|
I upgraded to the new version but whenever I click on File>New Workspace I do not get chart templates all that I get is a gray screen that lists the following:
Blank Workspace
Classic TC2000 Workspace
Open Saved Workspace
Am I not using the new version?
Thank you for any help you can provide.
|
|


Worden Trainer
Joined: 10/7/2004
Posts: 65,138
|
From your description of what happens, it would seem that you are running TC2000 version 12.2. If there are no recent workspaces listed but have saved Workspaces in TC2000 version 11 or 12, you can select any of the three options given to get started. If have not saved any Workspaces, you would need to select one of the first two options.
You can then add various elements to the Workspace by selecting them. For example you could select Charts and then choose one of the charts to add it to the Workspace.
If you want to run the TC2000 version 12.3 beta instead you can go to:
http://www.tc2000.com/beta
-Bruce
Personal Criteria Formulas
TC2000 Support Articles
|
|
|
Guest-1 |