| Welcome Guest, please sign in to participate in a discussion. | Search | Active Topics | |
Registered User
Joined: 3/16/2006
Posts: 2,214
|

|
|

Registered User
Joined: 4/18/2005
Posts: 4,090
|
We're probably due for it.
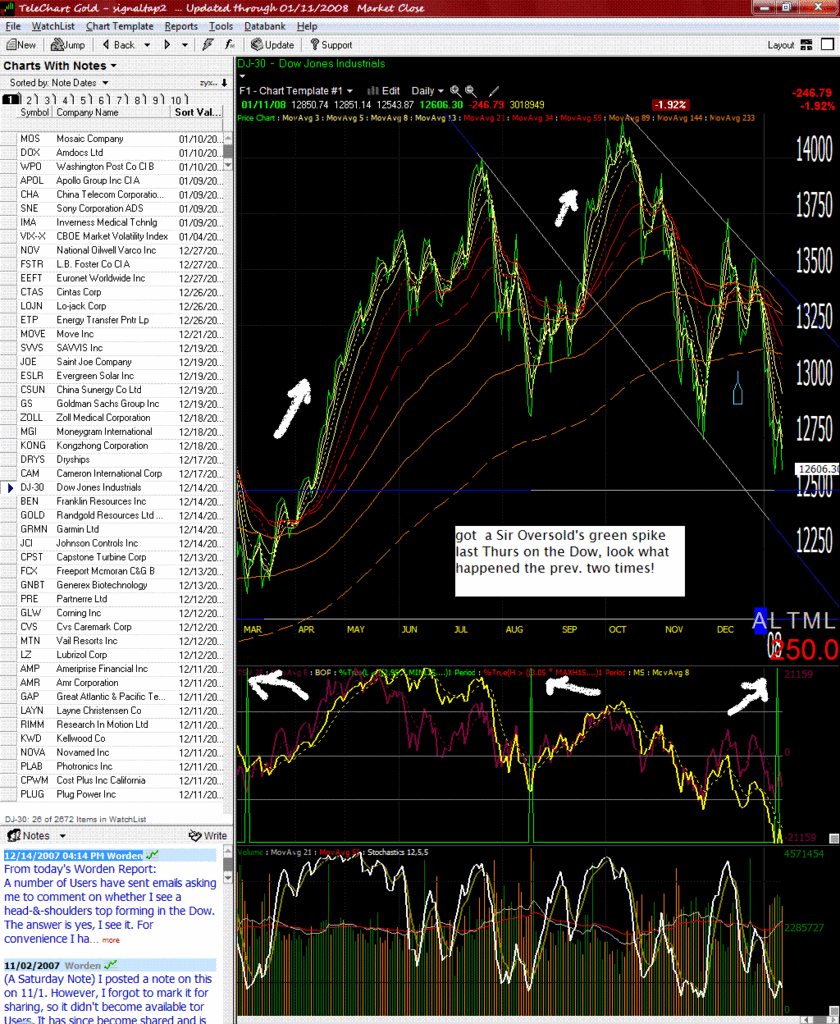
What is the formula for Sir Oversolds spikes ?
|
|
Registered User
Joined: 11/20/2007
Posts: 4
|
scottnlena; check worden report for formula 1-04-08.
|
|

Registered User
Joined: 4/18/2005
Posts: 4,090
|
For those curious the apropriate PCF was:
L<((2.95*MINL15.7)-MAXH7.3)/2 AND STOC50.3 < 10 AND L<L1
seems pretty nice. I didn't read the report.. so I'm not certain how else this is filtered.
However i'm not certain if I have this one right or not. It Seems correct in the formula from what is printed in the report but it's saying that generaly everythign is over bought.
If I have an error I can't see it ... any thoughts?
H > ((3.05* MAXH15.7) - MINL 7.3)/2 AND H> H1 AND STOC 50.3 > 50 AND TSV 3< TSV 8
|
|
Registered User
Joined: 9/25/2007
Posts: 1,506
|
Scott ...
We're talking about an indicator ... right ? not a PCF ?
I tried it like this ...
H>((3.05*MAXH15.7)-MINL7.3)/2 AND H>H1 AND STOC50.3>50 AND TSV3<TSV8
As adding an indicator ...
But ... I keep getting an error saying that the indicator must not return a boolean value ...
So ... apparently there has to be something to change a True or False to a 1 or 0 ...

|
|
Registered User
Joined: 1/28/2005
Posts: 6,049
|
A "percent true" indicator.
Thanks
diceman
|
|
Registered User
Joined: 9/25/2007
Posts: 1,506
|
QUOTE (diceman) A "percent true" indicator.
Thanks
diceman
Thanks diceman ...

|
|
Registered User
Joined: 9/25/2007
Posts: 1,506
|
Not sure what I'm doing wrong/different ...

But ... I'm not getting any spikes unless I goto multi-day ... and then ... they are definitely in the wrong place ...

|
|
Registered User
Joined: 9/25/2007
Posts: 1,506
|
OK ... I was using the overbought indicator ...
But ... when I use the oversold indicator like this ...

The only spike I get is August 16 ...

|
|
Registered User
Joined: 9/25/2007
Posts: 1,506
|
Doh !!
Never mind ...
I was on the NYSE chart ...

|
|
Registered User
Joined: 9/25/2007
Posts: 1,506
|
I don't know about this signaltap2 ...
I decided to take it back and apply it to the last H&S that I knew of in the Dow ....

Betting the farm on a bunch of "longs" here wouldn't have worked out all that well ....


|
|

Registered User
Joined: 12/31/2005
Posts: 266
|
looking at the dow since 2000, sir oversold's indicator didn't spike everytime the market was severly oversold, and there were some times when the indicator spiked and the rally was rather muted. with all this overhead the indicator will be put to the test. the incator also gave quite a few false signals in the qqqq's in 2001 & 2002.
so no a "holy grail" but a useful tool, when combined with other indicators.
|
|

Registered User
Joined: 12/31/2005
Posts: 266
|
a weekly stochastic gives about the same reading.
|
|
Registered User
Joined: 1/28/2005
Posts: 6,049
|
"so no a "holy grail" but a useful tool, when combined with other indicators."
---------------------------------------------------------------------
I'm not sure but its possible (I haven't looked) that these indicators
Overbought/Oversold may have more us with individual stocks.
Its possible indexes aren't friendly to these indicators because
they are less volatile.
Maybe a "milder" version would work better for indexes.
Thanks
diceman
|
|
|
Guest-1 |