Registered User
Joined: 10/19/2004
Posts: 56
|
In version7 I can create a custom indicator by doing Right Click->Add Indicator->Custom Indicator and I can select it to plot on the Top, the price chart. I can then enter a PCF to plot.
It overlays it on the chart. It works great.
In version 12.4, I do something similar and it always plots on the bottom without giving me an option to plot on the price chart.
Is there anyway to get a custom PCF to plot on top of price, not as an indicator on the bottom.
Not sure if what I'm saying is coming out clearly. Please reply if you need more detail on what I'm trying to do.
|

Administration
Joined: 9/30/2004
Posts: 9,187
|
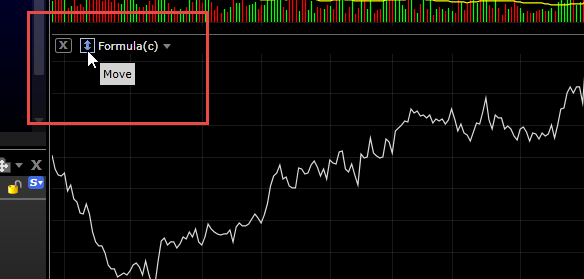
New custom formulas plot in their own pane if you select them from the Add Indicator menu. But you can move them once the are plotted by clicking the Move button.

You can also click on the Price History label on the price chart and select Add New Plot Here.
Attachments:
moveplot.png - 22 KB, downloaded 1,190 time(s).
|
Registered User
Joined: 10/19/2004
Posts: 56
|
Thanks for the quick reply. Did it. Works really nice. -- Thanks
|