| jz94117 |
|
Gold User, Member, Platinum User, TeleChart
|
| Registered User |
|
|
|
|
| Unsure |
|
| Saturday, July 21, 2007 |
| Saturday, June 29, 2013 12:27:26 AM |
188
[0.06% of all post / 0.03 posts per day] |
|
Bruce,
Thank you. You've made me a happy man.
Jim in SF.
|
Hi Bruce,
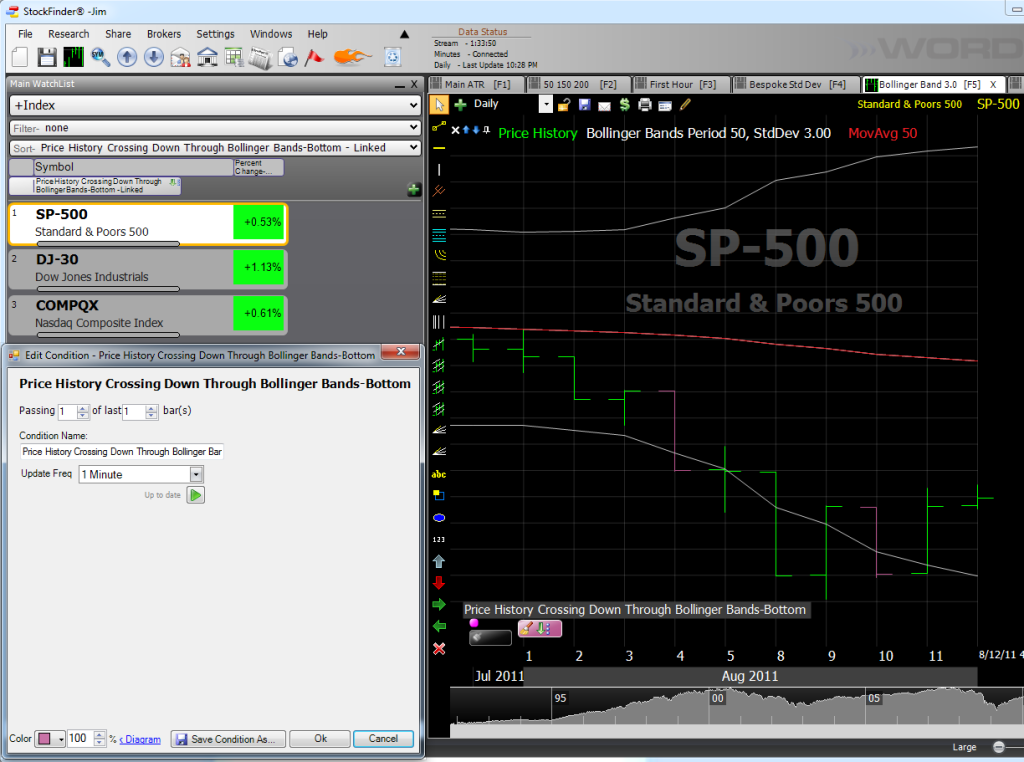
I hate to be such a fuss-budget, but is it possible to get the dates for August 9 and 11 painted too? (I would have gotten to this stuff last year if Parallels (which virtualizes Windows 7 on my Mac) had not taken so long to fix their bugs! )
Jim in SF.
|
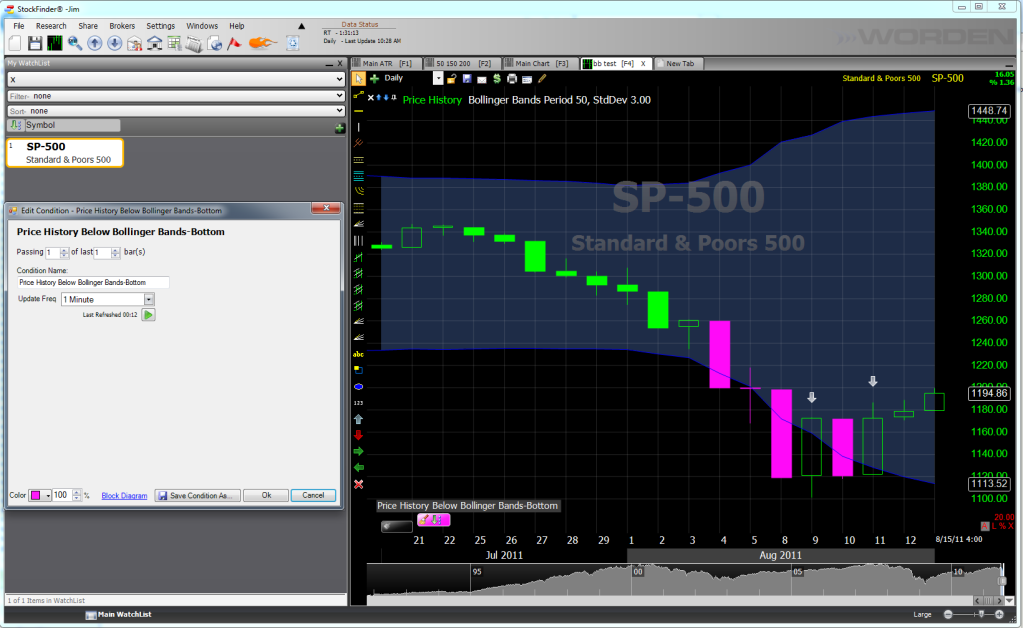
I am trying to paint all price bars that are below the 3 std. dev. bottom bollinger band. Here's is the result. Notice that the price bar for August 8, is not painted as it should be. Why is this?
Jim in SF.
|
Hi Guys!
I guess the subject matter says it all. How do I do this?
Happy trading!
Jim in SF
|
Thanks, Bruce.
I had forgotten all about the "i" icon.
Jim.
|
Hi Bruce,
What does the End of Day condition do? I tried looking it up in your online documentation, but couldn't find any description of how to use it or what values it measures. I'm assuming it's a boolean, true or false, whether the current bar is the end for the day?
Jim in SF.
|
Bruce,
You have a knack for making everything seem so easy and seamless. Thank you.
Jim.
|
|
OK, Bruce. I admit I haven't been keeping up with this forum. How do I create a Custom Index from my 5 market leaders, AAPL, GOOG, INTC, JWN, & WFR?
Secondly, I keep reading various statistics in the financial press, like "the last time the Dow was down 6 days in a row was X months ago" or "the last time the NYSE dropped 10% in 5 days was in 200__". Is it possible to calculate this stuff in Stockfinder?
Finally, I read in a blog I follow about the S&P 500 5-Day Average Hi/Lo Spread being at a 2 yr. high. In my inept fashion, I created the following real code but it doesn't work:
plot = [Price.High - Price.Low].MovingAverage(5)
so then I tried this:
plot = [(Price.high - Price.low) + (Price(1).high - Price(1).low) + (Price(2).high - Price(2).low) + (Price(3).high - Price(3).low) + (Price(4).high - Price(4).low)] / 5
Well, that doesn't work either. Can you give me a hand here?
Jim in SF
(who is not much of a programmer)
|
Wow. It actually worked (meaning, "I got it to work").
Thanks, Bruce. You guys are super!
Jim in SF.
|
I change time frames frequently. If I want to plot the 50 day SMA on an hourly chart, do I have to plot a 6-1/2 x 50 = 325 bar moving average? Or can't I fix it some way so that as I Ctrl-5 or Ctrl-2 the moving average stays the same?
Jim in SF.
|
|