| Gian64 |
|
Gold User, Member, TeleChart
|
| Registered User |
|
|
|
|
| Unsure |
|
| Sunday, January 23, 2005 |
| Thursday, November 10, 2016 4:13:24 AM |
36
[0.01% of all post / 0.01 posts per day] |
|
|
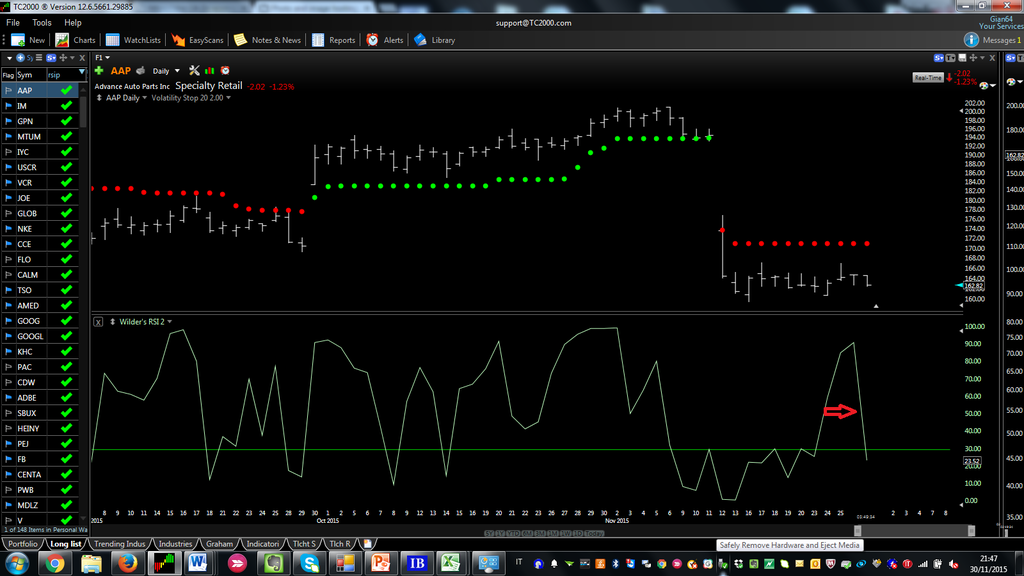
sorry to go back to this topic. I realised you already answered me ... but it doesn't work.
For AAP the flag on the top left says that yesterday RSI(2) was less than 30 but if you look at the picture it was more than 30
|
|
|
|
Thanks Bruce,
probably I did not explain myself correctly.
I woul like to do the same think you did with the stocastich in the posts above. I would like to create a Condition Formula.
If for the current bar the stocastich would be: STOC12.3 < 20 than for 1 bar ago is: STOC12.3.1 < 20
What would be the equivalent for the WilderRSI?
Regards, Giancarlo
|
|
Thanks Bruce,
and now the last one.
Could you write me the formula to get stocks that had the wilder rsi of 2 days lower than 20 yesterday? I can do it for the stocks of today but I would like to scan for stocks that had it less than 20 yesterday.
Thanks,
Giancarlo
|
|
Hi Bruce,
I would like to create a condition to get stocks that the day before had stochastic 12%K3 < 20.
I know how to get stocks that today have stochastic 12%K3 < 20 but I would like also the ones that had it yesterday < 20.
If it is possible I would like also the condition to get the ones that had it < 20 two days and three days ago.
Kind regards,
Giancarlo
|
|
THanks for your support.
Could you wrtite a scan condition to find stocks ahich close is greater that its 200 simple moving avegare.
Thanks,
Giancarlo
|
|
Thanks Bruce it works and it's what I am looking for: I can scan for stocks that have a linear regression that have a positive slope.
Now I would like to complicate it. Is that possible to scan for stocks that has a positive linear regression line and are part of of industries that have a positive linear regression too?
Thanks,
Giancarlo
|
|
Hi Bruce,
could you please create a condition criteria to scan for stocks that have the 200 days linear regression line with a positive slope?
Thanks,
Giancarlo
|
|
Thanks Bruce, I misanderstood the formula
Thanks,
Giancarlo
|
|
as you can see for ABCD the indicator on the chart is less than 30 but the screening on the left that use the condition I created with the formula you gave me is not flagged meaning that is more tha 30
Thanks,
Giancarlo
|
|