Good morning ApsII
Hope all is well.
I am definitely not a day trader.....nor a swing trader.....nor a buy and hold, be it short or long positions.
I just try to adapt to the current market conditions, and as you can see, there is a tad bit of uncertainty, and thus the triple digit DOW, as well as the double digit S&P/NASDAQ gains/losses, on what seems to be a daily basis.
Even though I always try to get to all cash, and advise people to do the same, by the end of the day, I have no problem holding a stock overnight, regardless of economic uncertainty, if I didn't get the gain that I wanted on that day. There is always the next day.
WIth regard to the information, I forgot to write down your contact information when you posted it the other day (thinking that it would always be here), and when I came back to site, it was no longer here. Maybe I am not looking in the right place. If so, I apologize.
If you want to look at some good ol' Big Money/High Freq Trader manipulation, go to ESV chart (intraday), and look at the aprox 9:32 a.m. and 11:34 a.m time frames. That is a big hint about near future direction, and these are the exact clues that will allow you to predict price action to within a few pennies (like I did with CRUS and HOG yesterday, as well as CRUS on Wednesday). It is also these types of clues that will allow you to forget about stops (once you learn these intentional and manipulative actions inside and out), which will do nothing but cause you to get taken out by these same intentional price spikes.
Remember the main purpose of these spikes, and trade accordingly (e.g. enter position with any % of upside/downside risk that you choose).
Happy Trading! And once again, sorry that I forgot to copy that Skype info the first time.
Jim
|
Hey ApsII
I usually mind my own business, but I can't resist.
I saw your post this morning on that Dan Zanger bada bing bada boop, or whatever it is. Are you crazy?
Candidates for long term investment? I hope you aren't talking stocks. And if you are, I hope by long term, you mean 1 to 7 days max. You know, about the amount of time that it takes for a nice quick parabolic run, and then getting out before even the first sign of weakness. Come on Maverick. Did you hit your head on the canopy when you ejected.
You know that I am just busting your chops........about hitting your head on the canopy.
Jim
|
P.S. CRUS is back up the vault again, just like yesterday. I found that it had unfinished business at 19.21 for sure, as well as possible unfinished business at 19.30. However, as with HOG, look at daily candlestick from yesterday, and the same applies. Chart says that max HOD today is aprox 19.66, but looking at this morning's price action, someone would have to shove an M-100 up its ass (and light it of course), and I don't see that happening.
As always, review indicators, yesterday's candlestick/price action, and if you agree, just like yesterday's advice on CRUS, it applies today as well....large capital expenditure and in and out by closing bell.
Also, do not use stops on these trades. The price action is figured out, and when you do that, the only way that you will get burned, is if the company is an acquisition target. You do not want one of the big money/black box spikes taking you out.
Happy Trading!
Jim
|
Good morning ApsII
You got it.
In the mean time, check out HOG. I found unfinished business between 27.72 and 27.83.
Back up the vault. It took out 27.72 early. It may or may not take out 27.83, and the chart says that max HOD is aprox 28.10, and that is if all the bull stars are aligned. Will never happen. Not in this market.
If you are lucky enough to get in somewhere between 27.55 and 27.70, snag it quick. This is just a quick in and out by closing bell trade. Look at yesterday's candlestick and you will see that there won't be much price action above yesterday's high, and will probably have LOD somewhere south of yesterday.
I already have 11000 shares for me, and got 15000 for my mother in law. The difference is that her margin account is a few hundred thousand more than mine. Plus, if the trade doesn't work out, it is a subtle way of getting back at her. HA HA!
Anyhow, verify 15 min through daily stochastics for yourself (as well as yesterday's candlestick), and you will see what I mean.
BACK UP THE VAULT MAVERICK!
Happy Trading!
Jim
|
Hello ApsII
I hope your trading day went well.
As you can tell, I pulled out my crystal ball, or at least that's what it felt like, gave it a good rub, and posted advice on what I refer to as a, "back up the vault," and dump every single penny into shorting CRUS "anywhere between 19.20 and 19.30." At the time that I posted (1:21:31 PM EST), CRUS was trading at exactly 19.17. Exactly 45 minutes later (1:57:00 PM), CRUS hit its HOD for the last time, when it hit 19.35.
As you and everyone else can see, even from the time that I posted, the maximum upside risk never exceeded 1.0%. And, if anyone out there had actually waited until the "anywhere between 19.20 and 19.30" bugle call, the max upside risk was obviously quite a bit less. In fact, I am currently rubbing my secret crystal ball calculator (it came with my secret crystal ball stock picker), at least that's what it feels like, and entry at the 19.29 price (because I said "between 19.20 and 19.30") resulted in maximum upside risk of 0.03%.
Anyhow, at exactly 3:02 P.M., CRUS hit its LOD at 18.56. Therefore, from the time that it hit 19.35, until the time that it hit 18.56 (65 minutes), shorting CRUS resulted in profit of 3.3% up to 3.8% (depending on entry price somewhere "between 19.20 and 19.30").
Hey tomson10.....are you interested in my secret crystal ball now? Did you take my advice; raid your grandma's sock drawer, and let everything ride on CRUS? Just kidding! Even a broken clock is right two times a day, right?
Gotta go rub the crystal ball for tomorrow's pick!
P.S. And yes, 1,065.25 at 3:03 PM to 1,070.37 by 3:51 PM can be considered an end of the day rally.
Jim
|
P.S. Short CRUS (anywhere between 19.20 and 19.30) with everything that you have, and everything that you can get your hands on... Go to Grandma's and take the money out of her secret hiding place (aka the sock drawer). Do not hold overnight!
Jim
|
|
Good day ApsII
Thanks for keeping an open mind at least. And don't worry, everyone is a skeptic, including myself. It's a protective mechanism and entirely appropriate.
I will get document to you sometime today. Just look it over, research and verify for yourself. Don't believe everything that you hear, including what you hear from me. Again, I am the same way. If I hear about something, be it rumors or market information, it doesn't exist until I verify it. That is just plain common sense. If, after researching, backtesting and verifying for yourself, you want to call B.S., you've got to do it! I would. It's only fair. But, before anyone can call B.S. on anything, you've got to put the effort in to try and refute. Don't be like tomson10. Just kidding... If you like what you find out, and choose to apply it to your own trading technique, go for it. And you can even pass it on to tomson10 if you want. I believe in helping out our fellow traders, because we all know that it's a never-ending battle, as it relates to trying to beat the market. Or should I say, Big Money and the Black Box.
I am currently busy keeping watch on price action for watchlist, as well as major indices. Charts show evidence of another end of the day rally, so prepare accordingly.
With regard to recent posts, go back and backtest some of the information that I provided, keeping in mind the day, as well as time of day, when figuring out total returns, as well as maximum risk, based on my calls.
For instance, I advised yesterday that GS (price at time was 148.60) was good long candidate up until 151.15 due to unfinished business at the 150.71 and 151.15 levels. So far today, it took out the 150.71 hurdle, and HOD thus far is 150.97. Chart shows that it will take out the last hurdle today, and will most likely give another 0.5% before petering out. If you got in when I advised yesterday, and get out when it takes out 151.15 later today, that is not a bad ROI. But don't hold it through tonight. That's just playing it safe.
Advised on Sunday morning that CMS was not safe short until 16.00, at which time, the upside risk (remember, short term one to two trading session time frame when I am quoting safe entry price and max risk) was 2%. Tuesday morning around 4:00 a.m EST, advised that, if still holding off on CMS, you could wait until 16.08. So far today, it hit 16.06, and by end of day will take out 16.08 and should end aprox 16.12. Or if you want, you can play it from current price right now (15.83) as a long, and then exit when it gets to 16.12. It will reach it, and will also reach the 16.50 level, with no more that 2.5% downside risk (and that's completely stretching it-----more like 1.0% to 1.5% downside risk max) in the not so distant future. But once again, remember that we only want to operate in the 1 to 2 trading session time frame max!
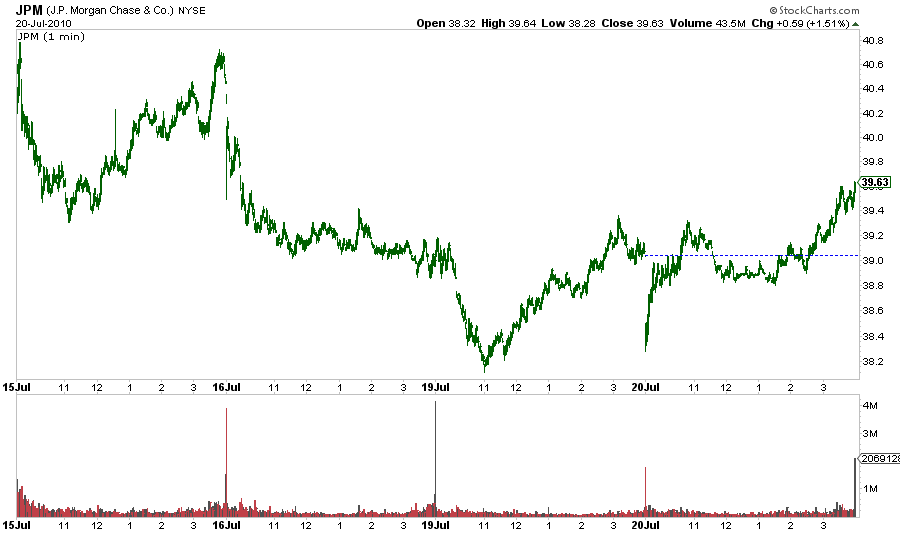
Advised yesterday that JPM was safe long until at least the 40.59 level due to unfinished business, as well. At the time that I advised of such (when I was having difficulty getting chart sample to you) , JPM was trading less than $39.00......something like 38.90 or so. Today it has HOD at 40.25 (already more than 3% gain since advising you at the sub 39.00 level). If you got in, get out when it challenges (may or may not surpass today, but it will) today's HOD. If you are unable to get out today because it doesn't challenge HOD, don't worry, keep the long position and get out at 40.31, or 40.50 level during next market rally. Again, chart says it will reach 40.50 level (at least), so that is what will happen.
Also go back and review ESV and HAL advice, once again, keeping in mind that the advice is valid for 1 to 2 trading sessions max. But guess what? So far, 2 to 3% minimum is not bad ROI, as it relates to recent posts. Just extrapolate, as it relates to per week, per month and per year.
To all the skeptics and naysayer's, it is perfectly appropriate response. Like I said before, I would do the same. But give ApsII time to go over information, and let him be the bearer of the good and/or bad news.
Gotta go....
Happy Trading everyone!
Jim
|
|
Hi Diceman
Thanks for pointing out the above discrepancy/contradiction, and believe me, I am not offended by it at all. I deserved it. Simply a matter of being new to a post and asking for advice/knowledge, in an albeit unorthodox and chicken crap way. Sorry about that. Please accept my apology, and the same for any other member who may have already read this.
With regard to any market "secret," I doubt that. Like I said in the post, I am probably the 5,000,000th out of 5,000,001 that has figured it out.
What have I figured out? Nothing that the majority of you don't already know. It's just that the majority refuse to believe that it actually exists, and has existed for longe than you and I have been around.
In a nutshell....how to determine when to go long or short, any stock, any sector, and limit upside/downside risk to less than 1%. Usually 0.5% or less. Well, actually more times than not, within 0.3% or less.
If you still feel like I am full of it, you can pick a stock , as long as the stock is currently in the S3 up through R3 channe (pivot point/S/R channel), and we will see who gets closer to the top price that that particular stock reaches, before it becomes a full on, back the vault up, short sell stock.
Or, and I am sure that you and the fellow member's would appreciate this one better....you could give me 2 to 3 stocks that you are interested in (same thing, they must be in the S3 up through R3 channel), and I will tell you which stock to pick, as far as it relates to entry price and highest % gain over the next few days. In addition, whichever stock that I pick, and you will be able to verify this, will have 0.5 to 1.0% downside risk max, while it makes its way to the target price. And, if you are currently holding some stocks, you could let me know entry price and what you are hoping for target price. I will then evaluate and let you know whether or not that is possible in a reasonable amount of time, and will let you know what your max downside risk is.. If you know max downside and/or upside risk, you never have to set a stop. When you set a stop, those darn price spikes always seem to come and ruin your day at the most inopportune time.
Well? Let me know what you decide. I already have two current shorts (ESV and HOG), and will be getting a long position tomorrow. This particular long will net me a minimum of $20,000 on my $500,000 initial entry based on 7/20 closing price. That's just under 4% net guaranteed. No stops or puts needed, as the very minimal downside risk won't call for it.
Let me know what you decide. And don't worry, negative economic (be it global or otherwise) will not prevent your stock pick from reaching the target price that I pick (just like the market today). Time frame? By the time that the major indices (or sooner) fail to surpass the June 21 highs and head back down to break through the July 1 lows. If you really like the long pick, you can rest assure that it will be ready to short (again, with very minimal upside risk) when everything heads back down. That makes it real easy, doesn't it Iceman?
Once again, sorry for the earlier blog and the obvious dick move. Hopefully, we can start fresh and actually assist each other from now on. And yes, even though I have it "figured out," doesn't mean that I will ever stop wanting to know anything and everything about the markets in general.
Jim
|
Hey ApsII
Sorry about that. This is what I tried to send a couple different times, before my wife got home and showed me how to do it the right way. Let me know if you are able to visualize everything on the chart. As you can see, this is JPM one minute chart for the last four trading days. The gaps are pretty obvious. I obviously changed and altered some of my stockchart.com settings, in order to help you better visualize the chart.
Also, I have some information that I want to send to you, but it is not for posting. Let me know if there is a different way to send it, other than this site. Once you read and verify this information, I will let you determine who you want to share it with after that. If you were to read through and verify what I send to you, sometime tonight, you will see that, instead of protecting assets and playing it safe while waiting for the next market extreme, you can make as much as you want for the rest of this week, as well as any other week. This is not some type of advertisement, I promise. I do not provide market advice in exchange for money. I don't have the time, nor do I need extrra income. This is just my trading style based on 24/7 chart dissection. What can I say? I get one to two hours of sleep per night, and have always been that way. Take a look at the information. It won't take someone with your knowledge very long to see that the information contained in the document is priceless. And, if I was able to figure it out, as it relates to how the market actually works, there are numerous others who have done so as well. In other words, I'm probably the 5,000,000th person out of 5,000,001 who have figured this out.
Let me know if the chart comes through okay, and let me know how to send other information.
Thanks
Jim
|
http://stockcharts.com/h-sc/ui?s=GS&p=1&yr=0&mn=0&dy=6&id=p06157008083&a=204533323
Hey ApsII
Check that last GS message. I just went back and manipulated number of days viewed on the GS chart, and you will see that there are a couple more unfilled gaps, well actually one uninterrupted gap from 150.71 through 151.15. Even with HOD currently at 148.60, you can see that, should it decide to fill these upper most gaps, the upside % risk is a little less than 2%. Sorry about the confusion.
Jim
|
|