Registered User
Joined: 10/7/2004
Posts: 89
|
when displaying macd the up bars and the down bars are rarely at the 0 line. Why is this and how can I get them to dispaly at the 0 line. Thanks
|

Administration
Joined: 9/30/2004
Posts: 9,187
|
Are you referring to the MACD histogram? This plots the difference between the MACD line and its moving average (signal line). I don't really understand your question.
|
Registered User
Joined: 10/7/2004
Posts: 89
|
yes the histogram.
|
Administration
Joined: 9/30/2004
Posts: 9,187
|
The histogram will only be at the 0 line when MACD crosses up or down through its moving average.
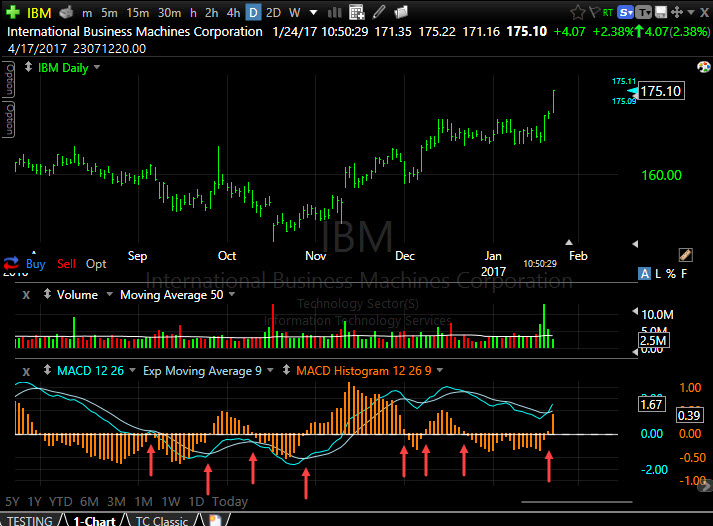
Attachments:
macd.jpg - 152 KB, downloaded 508 time(s).
|

Worden Trainer
Joined: 10/7/2004
Posts: 65,138
|
The histogram is always going to plots it bars in such as way that negative values extend down from below the zero line and positive bars extend up above the zero line, so I don't quite know what you mean by the bars rarely being at the zero line.
If you have the regular MACD and the MACD Histogram plotted in the same pane, you may want to check to see if they are overlayed into the same scale as well. This would force the zero lines to match.
How to Overlay an Indicator
If you just want the zero line to be in the middle of the pane, you can click on the indicator to select Scaling... and then set the Scale Method to Center On Zero.
-Bruce
Personal Criteria Formulas
TC2000 Support Articles
|