| Welcome Guest, please sign in to participate in a discussion. | Search | Active Topics | |
Registered User
Joined: 1/19/2009
Posts: 32
|
Hi,
I am trying to create overbought and oversold lines and shade above and below them, respectively. What I am looking for is exactly what comes with Stochastics by default, except I would like to apply this to some of my own indicators.
Most of these indicators are market data readers, if thats relevant.
I have searched the forums and found a few similar attempts, most notably:
http://forums.worden.com/default.aspx?g=posts&t=44472
However I am having trouble adapting this to my needs.
I also found this:
http://forums.worden.com/Default.aspx?g=posts&t=35080
Which looks like what I want, but I don't think you can do this in SF5
Create New | Indicator from Block Diagram.
I would really appreciate some assistance.
Cheers,
Stoker
|
|


Worden Trainer
Joined: 10/7/2004
Posts: 65,138
|
If you replace the first line of the directions given in Shading an area between a custom indicator and a horizontal line with:
- Add Indicator/Condition to Chart | New Indicator from Diagram (at the bottom of the list).
Everything else looks like it should be the same.
Block Diagrams have been de-emphasized in StockFinder but the Your First 3 Block Diagrams video covers creating Block Diagrams. Most people don't do much with Block Diagrams and use Drag and Drop or RealCode exclusively.
-Bruce
Personal Criteria Formulas
TC2000 Support Articles
|
|
Registered User
Joined: 1/19/2009
Posts: 32
|
Hi Bruce,
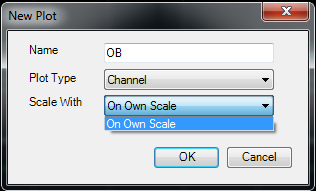
I get as far as selecting "Your Custom Indicator" from the "Scale With" drop down.
I don't have "Your Custom Indicator" in this drop down, only "On Own Scale".
See below:
Any ideas?
|
|
Worden Trainer
Joined: 10/7/2004
Posts: 65,138
|
OK. Choose On Own Scale and when the new Indicator is done being created, Drag and Drop the new Indicator onto your base Indicator (onto the Indicator itself) and select Overlay with (your base Indicator) to get it into the same Pane and Scale.
-Bruce
Personal Criteria Formulas
TC2000 Support Articles
|
|
Registered User
Joined: 1/19/2009
Posts: 32
|
Hi Bruce,
I have created the OS indicator sucessfully as you describe. However I am unable to drag it onto my base indicator (or any indicator). When I drag it I get the red circle icon (not sure what you call it).
Actually Its the same experience as when I try to drag the OS or OB indicator from stochastics to any other indicator.
|
|
Worden Trainer
Joined: 10/7/2004
Posts: 65,138
|
Sorry. I had forgotten that Channel Plots could not be Dragged and Dropped as described.
Right-click on the Indicator and select Copy and then right-click in then right-click in the Pane in which you wish to place it and select Paste. You may need to right-click on the Indicator and select Scaling | Scale With | (the Indicator on which it is based) to get it into the same Scale (but probably not).
-Bruce
Personal Criteria Formulas
TC2000 Support Articles
|
|
Registered User
Joined: 1/19/2009
Posts: 32
|
Thanks Bruce - done.
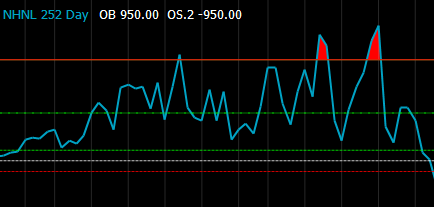
One small thing, is it possible to hide the value of the indicator from the legend?
I have named them OB and OS, but the value is being displayed (see below) - can I hide this?
|
|
Worden Trainer
Joined: 10/7/2004
Posts: 65,138
|
If you right-click on the Indicators and select Edit, you should be able to select Block Diagram near the lower left corner. You can double-left-click on the Parameter: Decimal Number Blocks to Edit them. Change Show in Legend to False.
-Bruce
Personal Criteria Formulas
TC2000 Support Articles
|
|
Registered User
Joined: 1/19/2009
Posts: 32
|
Thanks again Bruce - done.
|
|
Worden Trainer
Joined: 10/7/2004
Posts: 65,138
|
You're welcome.
-Bruce
Personal Criteria Formulas
TC2000 Support Articles
|
|
|
Guest-1 |