| Welcome Guest, please sign in to participate in a discussion. | Search | Active Topics | |
Registered User
Joined: 1/1/2005
Posts: 2,645
|
We will show how to write PCFs for RSMA. We will write a PCF for RSMA10 upcrossing RSMA40. Unfortunately, the PCF has to be rewritten before each use after a data update. Fortunately, this is essentially as simple as typing 41 C's.
1) Write the PCF:
1000000*
(0/C0+1/C1+2/C2+3/C3+4/C4+5/C5+6/C6+7/C7+8/C8+9/C9
+10/C10+11/C11+12/C12+13/C13+14/C14+15/C15+16/C16+17/C17+18/C18+19/C19
+20/C20+21/C21+22/C22+23/C23+24/C24+25/C25+26/C26+27/C27+28/C28+29/C29
+30/C30+31/C31+32/C32+33/C33+34/C34+35/C35+36/C36+37/C37+38/C38+39/C39+40/C40)
/41
Check "Do not update this criteria". The 1000000 is solely for the purpose of moving the decimal point in the result when testing.
2) Test the PCF in 1) on the Symbol SP-500 and copy the test window. The result for 07/27/07 is:
1000000.00 * (0.00 / 1458.95 + 1.00 / 1482.66 + 2.00 / 1518.09 + 3.00 / 1511.04 + 4.00 / 1541.57 + 5.00 / 1534.10 + 6.00 / 1553.08 + 7.00 / 1546.17 + 8.00 / 1549.37 + 9.00 / 1549.52 + 10.00 / 1552.50 + 11.00 / 1547.70 + 12.00 / 1518.76 + 13.00 / 1510.12 + 14.00 / 1531.85 + 15.00 / 1530.44 + 16.00 / 1525.40 + 17.00 / 1524.87 + 18.00 / 1519.43 + 19.00 / 1503.35 + 20.00 / 1505.71 + 21.00 / 1506.34 + 22.00 / 1492.89 + 23.00 / 1497.74 + 24.00 / 1504.07 + 25.00 / 1522.19 + 26.00 / 1512.84 + 27.00 / 1533.70 + 28.00 / 1531.05 + 29.00 / 1532.91 + 30.00 / 1522.97 + 31.00 / 1515.67 + 32.00 / 1493.00 + 33.00 / 1509.12 + 34.00 / 1507.67 + 35.00 / 1490.72 + 36.00 / 1517.38 + 37.00 / 1530.95 + 38.00 / 1539.18 + 39.00 / 1536.34 + 40.00 / 1530.62) / 41.00
3) Place a C in front of each of the 41 integers in the numerators. The result for 07/27/07 is the PCF:
1000000*
(C0.00/1458.95 + C1.00/1482.66 + C2.00/1518.09
+ C3.00/1511.04 + C4.00/1541.57 + C5.00/1534.10
+ C6.00/1553.08 + C7.00/1546.17 + C8.00/1549.37
+ C9.00/1549.52 + C10.00/1552.50 + C11.00/1547.70
+ C12.00/1518.76 + C13.00/1510.12 + C14.00/1531.85
+ C15.00/1530.44 + C16.00/1525.40 + C17.00/1524.87
+ C18.00/1519.43 + C19.00/1503.35 + C20.00/1505.71
+ C21.00/1506.34 + C22.00/1492.89 + C23.00/1497.74
+ C24.00/1504.07 + C25.00/1522.19 + C26.00/1512.84
+ C27.00/1533.70 + C28.00/1531.05 + C29.00/1532.91
+ C30.00/1522.97 + C31.00/1515.67 + C32.00/1493.00
+ C33.00/1509.12 + C34.00/1507.67 + C35.00/1490.72
+ C36.00/1517.38 + C37.00/1530.95 + C38.00/1539.18
+ C39.00/1536.34 + C40.00/1530.62)
/41.00
This is 1000000 times RSMA41. The .00's are unnecessary, but they do no harm. The RSMA10, RSMA40, RSMA10.1, and RSMA40.1 are obtained from the RSMA41 by deletion or by copying just the portion required.
4) Construct the PCF for RSMA10 upcrossing RSMA40 from the PCF in 3). The result for 07/27/07 is:
(C0.00/1458.95 + C1.00/1482.66 + C2.00/1518.09
+ C3.00/1511.04 + C4.00/1541.57 + C5.00/1534.10
+ C6.00/1553.08 + C7.00/1546.17 + C8.00/1549.37
+ C9.00/1549.52)/10
> (C0.00/1458.95 + C1.00/1482.66 + C2.00/1518.09
+ C3.00/1511.04 + C4.00/1541.57 + C5.00/1534.10
+ C6.00/1553.08 + C7.00/1546.17 + C8.00/1549.37
+ C9.00/1549.52 + C10.00/1552.50 + C11.00/1547.70
+ C12.00/1518.76 + C13.00/1510.12 + C14.00/1531.85
+ C15.00/1530.44 + C16.00/1525.40 + C17.00/1524.87
+ C18.00/1519.43 + C19.00/1503.35 + C20.00/1505.71
+ C21.00/1506.34 + C22.00/1492.89 + C23.00/1497.74
+ C24.00/1504.07 + C25.00/1522.19 + C26.00/1512.84
+ C27.00/1533.70 + C28.00/1531.05 + C29.00/1532.91
+ C30.00/1522.97 + C31.00/1515.67 + C32.00/1493.00
+ C33.00/1509.12 + C34.00/1507.67 + C35.00/1490.72
+ C36.00/1517.38 + C37.00/1530.95 + C38.00/1539.18
+ C39.00/1536.34)/40
AND
(C1.00/1482.66 + C2.00/1518.09
+ C3.00/1511.04 + C4.00/1541.57 + C5.00/1534.10
+ C6.00/1553.08 + C7.00/1546.17 + C8.00/1549.37
+ C9.00/1549.52 + C10.00/1552.50)/10
<= (C1.00/1482.66 + C2.00/1518.09
+ C3.00/1511.04 + C4.00/1541.57 + C5.00/1534.10
+ C6.00/1553.08 + C7.00/1546.17 + C8.00/1549.37
+ C9.00/1549.52 + C10.00/1552.50 + C11.00/1547.70
+ C12.00/1518.76 + C13.00/1510.12 + C14.00/1531.85
+ C15.00/1530.44 + C16.00/1525.40 + C17.00/1524.87
+ C18.00/1519.43 + C19.00/1503.35 + C20.00/1505.71
+ C21.00/1506.34 + C22.00/1492.89 + C23.00/1497.74
+ C24.00/1504.07 + C25.00/1522.19 + C26.00/1512.84
+ C27.00/1533.70 + C28.00/1531.05 + C29.00/1532.91
+ C30.00/1522.97 + C31.00/1515.67 + C32.00/1493.00
+ C33.00/1509.12 + C34.00/1507.67 + C35.00/1490.72
+ C36.00/1517.38 + C37.00/1530.95 + C38.00/1539.18
+ C39.00/1536.34 + C40.00/1530.62)/40
Repeat Steps 2), 3), and 4) before use after an update. If you do not mind typing 41 C's, obtaining the PCF is easy.
Thanks,
Jim Murphy
|
|
Registered User
Joined: 1/28/2005
Posts: 6,049
|
If one desires a PCF that does not require
updating.
One of the FX symbols can be used
in place of the SP-500.
(FX10, FX20 and so on)
However you should be aware that your
reference symbol never declines in value.
Thanks
diceman
|
|
Registered User
Joined: 3/4/2009
Posts: 160
|
How would you write this for a rsma per industry?
|
|

Administration
Joined: 9/30/2004
Posts: 9,187
|
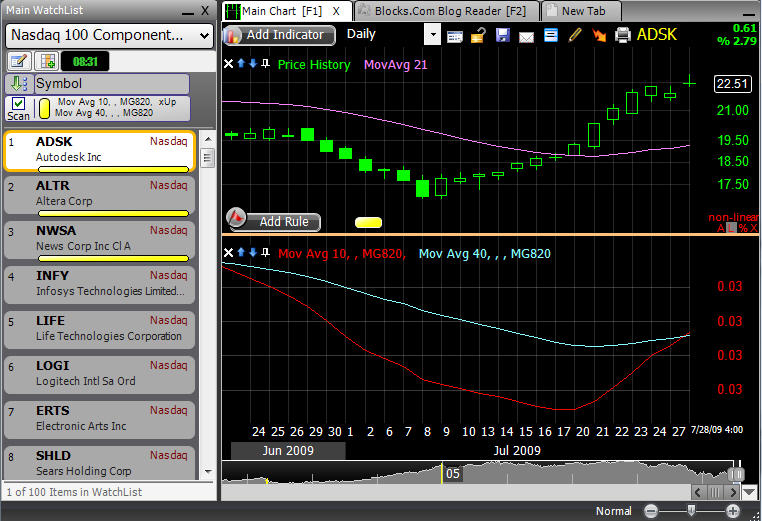
There is an indicator in the StockFinder libary called Industry RSMA which plots two RSMAs using the active symbol's main or sub-industry average.
You can then drag one average onto the other and create a rule for crossing up, crossing down, above, below, etc. and check the Scan Watchlist option and it will light up the stocks that pass the rule.
I created a rule for the short RSMA crossing up through the long RSMA and ADSK, ALTR and NWSA from the Nas 100 passed the rule when I ran it tonight.
|
|

Worden Trainer
Joined: 10/7/2004
Posts: 65,138
|
kcaughron31,
If you want to do this in TeleChart, you would need to create a different PCF for each Industry and Sub Industry of interest every day. The basic technique is the same as what was outlined by bustermu in his post except that you would choose the symbol for the Industry or Sub Industry in step 2 instead of the symbol for the Standard & Poors 500 (SP-500).
In addition to making a different PCF for each Industry and Sub Industry of interest each day, you would need to choose the correct formula when making the comparison as the correct Industry or Sub Industry will not be chosen automatically.
-Bruce
Personal Criteria Formulas
TC2000 Support Articles
|
|
|
Guest-1 |