| Welcome Guest, please sign in to participate in a discussion. | Search | Active Topics | |
Registered User
Joined: 1/7/2014
Posts: 26
|
I only want to hold onto a position for 3-14 days, so I look for patterns on an hourly chart and base my entry/exit points off of that chart. I also look at the daily chart as a reference to make sure that I'm not going against the bigger trend.
I'm use a couple different indicators to look for opportunities, for example: I look at Stochastics, MACD, Force index and BOP.
Now, I know that all indicators will work in different timeframes, but are they as effective in all timeframes or do they give too many false signals in smaller timeframes? In your experience are there any indicators that do not work well on different timeframes or work best on certain timeframes (hourly, 4 hour, daily, weekly, etc.)?
|
|


Worden Trainer
Joined: 10/7/2004
Posts: 65,138
|
The trainers can't give setting, interpretation or investment advice. I'll move this topic to the Stock and Market Talk forum where other traders are more likely to see it.
I can provide the generalization that shorter periods for indicators generally result in more sensitive indicators but that the same is not necessarily true of shorter time frames.
-Bruce
Personal Criteria Formulas
TC2000 Support Articles
|
|
Registered User
Joined: 1/28/2005
Posts: 6,049
|
If youre holding 3 to 14 days daily really is your timeframe. (almost weekly)
Intra-day can only "refine" entrys and exits.
The trend actually happening over the next 14 days and your stop size will probably
determine sucess/failure vs an hourly indicator reading.
Thanks
|
|
Registered User
Joined: 1/7/2014
Posts: 26
|
Thanks Diceman,
I find when I'm looking for patterns in the Daily chart it takes too long for things to play out one way or another (sometimes a month or more). I found that when I look for the patterns in the hourly chart things play out much faster (generally less that 1 week). I seem to be conistant trading signals that work when looking at this timeframe.
So back to the orignal question, are the indicators just as effective in an hourly chart as a daily?
|
|
Registered User
Joined: 1/28/2005
Posts: 6,049
|
QUOTE (briannosaurus.rex)
conistant trading signals that work when looking at this timeframe.
Doesnt that answer your question?
If you "see" things that "work"
but they dont when you actually trade something else is going on.
The problem with "work" is it needs definitions.
If someone tells you "yes they work" they could be exiting in the next hour or two
and not holding for multiple days.
Thanks
|
|
Registered User
Joined: 1/7/2014
Posts: 26
|
The consistant trading signals are from price/volume patterns in the chart only. I confirm with indicators some of the indicators mentioned above. So I guess the definition is:
When looking at technical indicators, do they give too many false signals in the shorter timeframes? Or do they work better (less false signals) in the daily chart.
For example:
If I use Stotchastics to figure out when to exit a position (moving down through 80). And I look at the hourly, it has a value of 78 and is moving down, giving me my sell signal. But when I look at the same thing on a daily it's been holding out at 100 for the past couple days, which means I would just hold onto the position until it crosses down through the 80.
Does that clear things up? Or is there no real answer for this question because everything is so subjective and I would have to just test to see what works best for me and my trading style?
|
|
Registered User
Joined: 1/28/2005
Posts: 6,049
|
There is always the Risk/Reward equation.
We not only risk loss we risk the actual move.
So when you look at the hourly you can reduce risk by getting out now.
However you "risk" missing a larger move that is underway on the daily.
There is always the possibility of using longer period indicators.
(a 65 period moving average on a 30min chart (13 bars*5) is equivalent to a 5 day daily moving average)
So maybe a longer period Stoc indicator with a sell threshold of 50 would work better?
It would keep you in longer vs the 80 line on an hourly
but it wont change the fact that it still can go down more.
You are sort of bridging the gap between two timeframes.
The general rule of thumb is when the enviornmet is very bullish it pays to hold.
Thanks
|
|
 Gold Customer Gold Customer
Joined: 11/11/2006
Posts: 359
|
The true day traders among us could think differently, but the problem is to find a method of trading that will give you a acceptable % profit and hold time frame. Many of the short-term hold strategies will give you a large win rate, but not a large % win rate. Unless you are heavily leveraged you cannot make it on less that 1% profit per trade and be plagued with the usual problems of poor fills, commissions, slippage, et.al.
A suggestion to you, if I may: Get several College Ruled Spiral Notebooks. To explore a strategy, go back about 10 years. Move forward one click at a time. Record entry price and exit price, according to your strategy. Record the days that you would have held the equity. From this you can determine :1. The win rate 2. the average Percent each trade made or lost 3. The number of days average trade takes. This is a close as possible to trading without losing actual money. You will find a favorite.
You will find that no single strategy will be the best to use in all situations. But if it doesn't get you out in the '08's and '09's look for something else. I don't really think, over the long run, there will be much difference in most indicators, regarding time frames. Be aware that on a partcular stock, weekly may be better that daily, on another, the opposite is true.
Check "Trading Naked" Stoch REI and Conservative MACD setup. Holding period is about what you like
Good Luck
Mammon
|
|

Registered User
Joined: 6/6/2005
Posts: 1,157
|
Diceman is right. 3 to 14 days, daily charts.
The indicator is working as it should on the hourly chart -- that's how short the trades are. If you are trading on the hourly, you should stick to the hourly (IMO).
Get your support/resistance levels and trend direction from the daily. Trade the hourly. But you can't have it both ways -- be a trend trader on the daily when you see you got out too early by being a range trader on the hourly chart.
At least that is what I have learned.
You could also drop the stoch all together and trade on price.
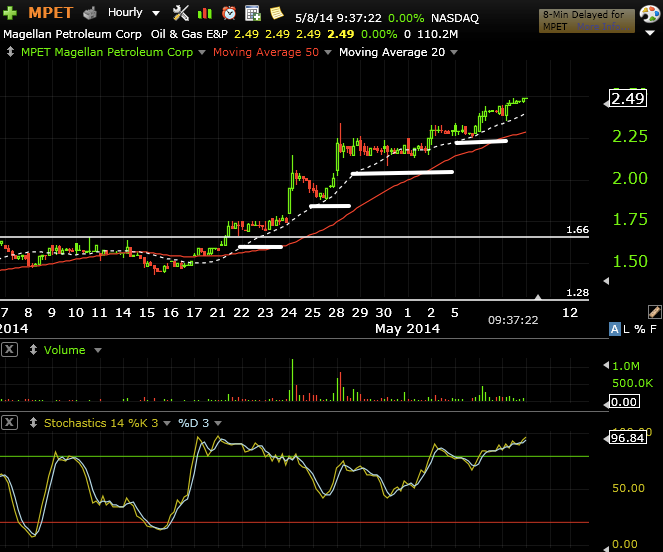
Here's the hourly chart of MPET with a nice trend.
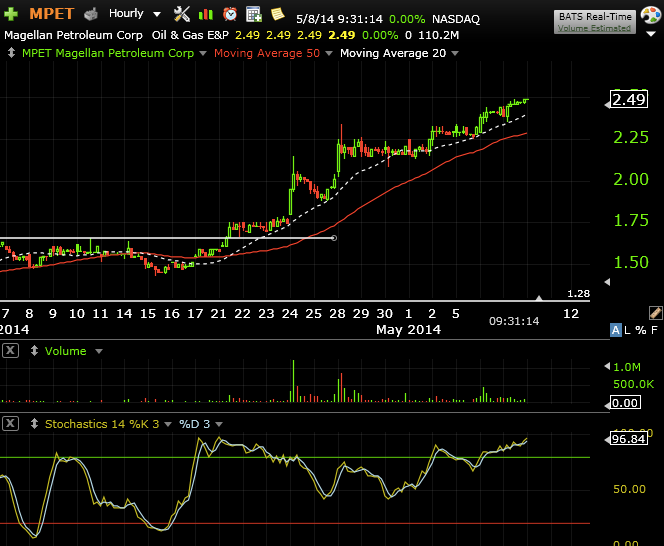
But if you were using stochastics here you would have blown it.
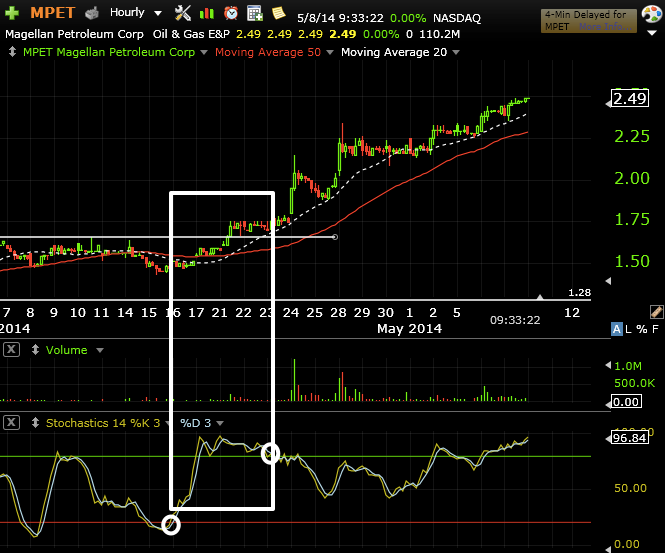
You would have gotten an okay move and you would have learned the truth about stochastics -- it sucks with trends. In fact I couldn't extend the length out far enough to create a really good trade on this chart.
As diceman has said in the past -- you have to pick a side.
Stochastics on the daily chart looks even worse to me.
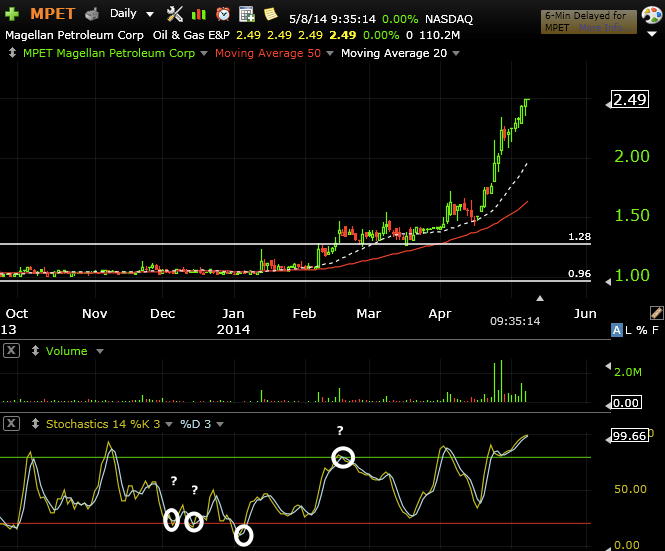
The question becomes (at least to me) -- does stochastics even given you an edge in this situation? I'd say no.
Better, in my opinion, to trade price. Move your stops up under swing lows. The real work is working on yourself enough to be able to let a winner run.
It's never the indicator's fault -- or job to get me into and keep me in a winning trade or out of a losing one -- that responsibility lies with me.
Good luck out there and thanks for the interesting question!
David John Hall
|
|
|
Guest-1 |