| Welcome Guest, please sign in to participate in a discussion. | Search | Active Topics | |
Registered User
Joined: 1/2/2008
Posts: 41
|
How I can shade the area between a custom indicator and a horizontal line, let's said the area above a given line?
|
|


Worden Trainer
Joined: 10/7/2004
Posts: 65,138
|
- Right-click on the Pane with your Indicator and select Create New | Indicator from Block Diagram.
-- Name: Up to you.
-- Plot Type: Channel
-- Scale With: Your Custom Indicator.
What you do next depends on if you want to Shade above or below the Custom Indicator. If you want to Shade below it:
- Left-click and Drag on the Date & Number Series input of Channel Top.
- Select Link From Another Tool and choose your Custom Indicator.
- Left-click and Drag on the Number input of Channel Bottom.
- Select Select Block & Connect | Parameter: Decimal Number.
- Double left-click on the Parameter: Decimal Number Block.
- Change the Value to where you want the line.
Shading above just involves using your Custom Indicator as the input to the Channel Bottom and the Parameter: Decimal Number as the input to the Channel Top.
-Bruce
Personal Criteria Formulas
TC2000 Support Articles
|
|
Registered User
Joined: 12/31/2005
Posts: 2,499
|
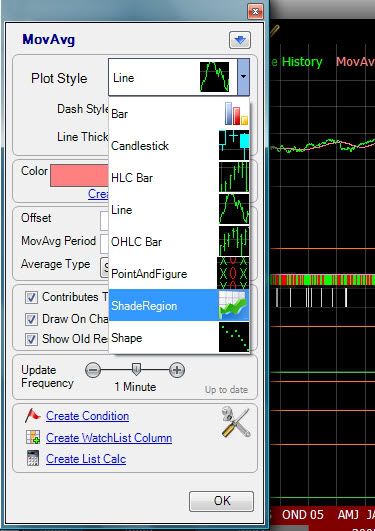
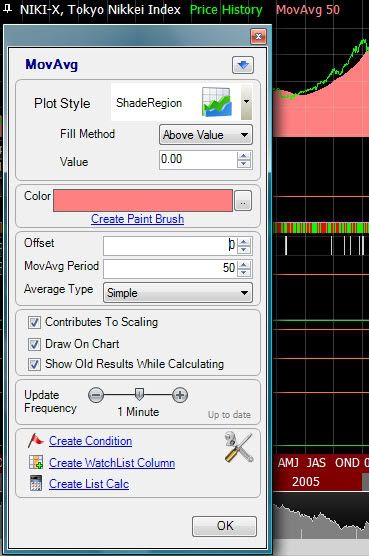
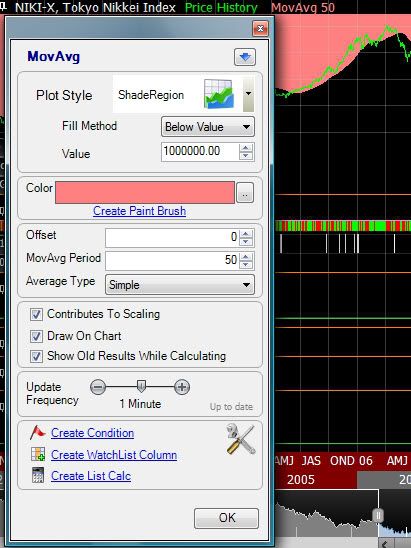
Another interpretation of your question would be to edit the Plot Style:
1. selected shaded region

2. for below set value to 0 and select Above Value to shade from o to the line

or Pick Below Value and select a value high enough to be above the max expected

|
|
Registered User
Joined: 1/2/2008
Posts: 41
|
Thanks a lot!
|
|


Worden Trainer
Joined: 10/7/2004
Posts: 65,138
|
rlb1987,
You're welcome. Our pleasure.
-Bruce
Personal Criteria Formulas
TC2000 Support Articles
|
|
|
Guest-1 |