
Registered User
Joined: 6/6/2005
Posts: 1,157
|
Hey everyone,
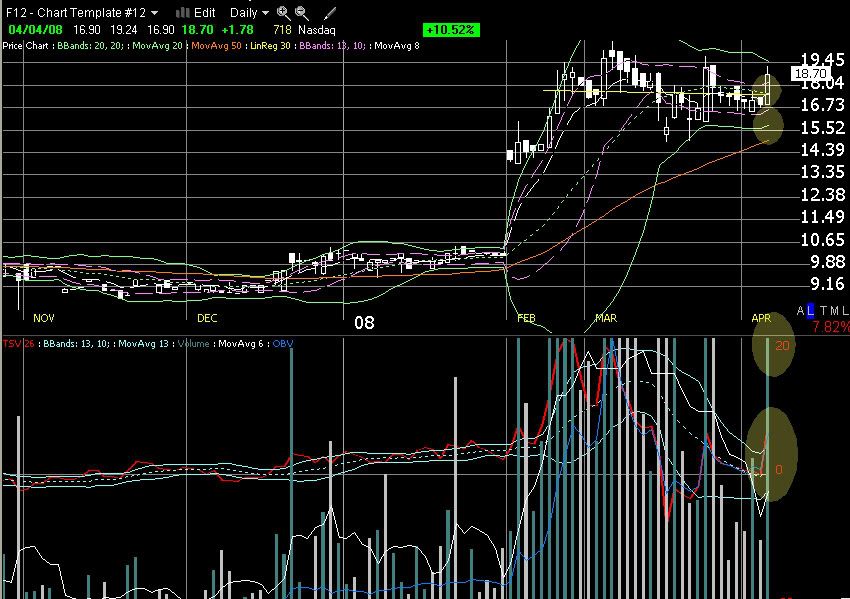
It's my belief that reviewing our losers often times offers more insight than gloating over our winners. In that spirit, I offer up GENC -- the breakout fake out Darvas box cheat. :) Found a week or so ago and entered off a break of the most current Darvas box on strong volume. A small cap, with a great valuation, and lots of momentum. Aparently, earnings were positive but not high enough for a high growth prospect and pow, all bets are off.
What i learned from this, and from studying these breakouts all weekend, is that:
1) If you're trading breakouts there will be a lot of failures.
2) Position size is important. Look at the worsk case scenerio, trade a percentage of equity you are comfortable losing, and accept the risk beforehand. Luckily i did this and had a 20% stop positioned in so that this loss was very manageable. Had I over positioned, and not taken into account the worst case scenerio, this could have been catastrophic.
3) Although many stocks go onto double in any market environment, the success rate favors market correlation. Studying these all weekend leads me to believe that the breakouts have a higher success rate when the indexes are trading above their 200 dayMA.
Here are the charts.
Breakout:
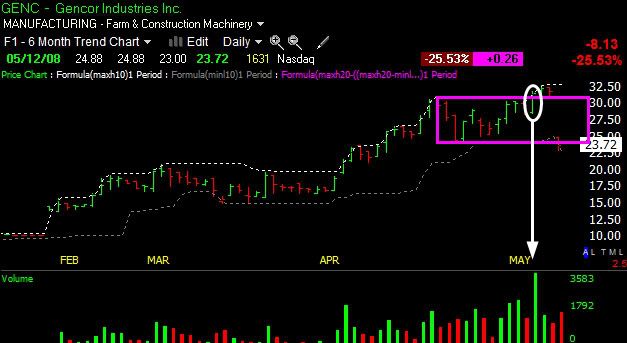
Becomes fakeout:
Onto the next.
David John Hall
|
|
Registered User
Joined: 12/2/2004
Posts: 1,775
|
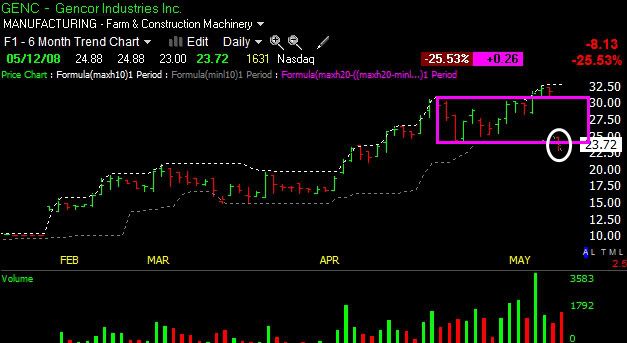
david, good analysis/wisdom and kudos for sticking to your plan and taking the stop loss. But I highly doubt Darvas would have added on that latest box breakout of May 7; it was just way too extended from its previous breakout box, about 50% eyeballing the chart. The two times for entry imo would have been the Feb. breakout from the long sideways pattern, then the early April box breakout on 4/7. Recent price action would be time imo to start thinking about exit strategy as price had about tripled in just a short 3 months. But who knows, just my opinion....I enjoy your posts.
|
|
Registered User
Joined: 12/2/2004
Posts: 1,775
|
Wow, I had not updated its chart and now I see the big gap down, was not reflected in my post above. Big lesson there is that holding a position into earnings is always a roulette spin. A good rule imo is to always sell at least a minimum of 1/2 the position day or two before earnings, if not all. Can always buy back after things settle down and chart still looks good...sometimes you get a better price, sometimes not, but over time it's a good strategy I think.
|
|
Registered User
Joined: 6/6/2005
Posts: 1,157
|
fpetry,
Thanks for your insight. i enjoy your posts as well. I agree. Normally i check earnings dates, but for some reason did not here. Another great lesson learned.
I'm not sure about your analysis of darvas and his addon zones, however. I will have to recheck the book and the charts when I get home but i believe there a couple in there where he adds on at prices that are quite extended as long as a new box is forming. His belief being that you never knew when the top will come. Until you know. As is the case with GENC. lol
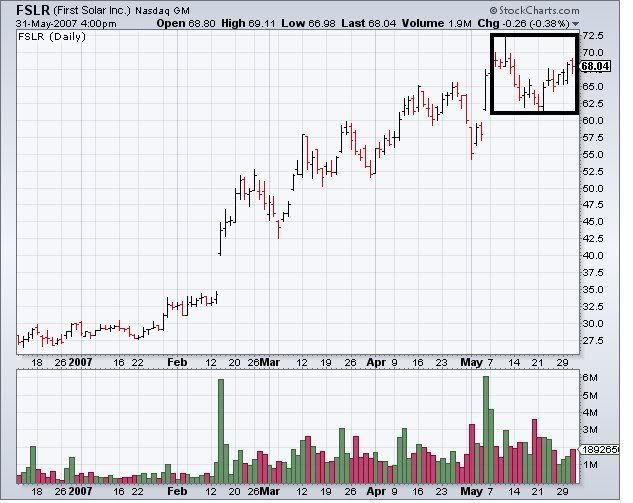
For instance, take a look at the chart for FSLR -- cherry picked agreed -- but how many buy points are there in that stock? How many doubles, tripples, etc?
I think another main failure with GENC is the "forward looking industry" factor. FSLR and the solar industry is on the cutting edge. GENC, and the road building industry maybe not.
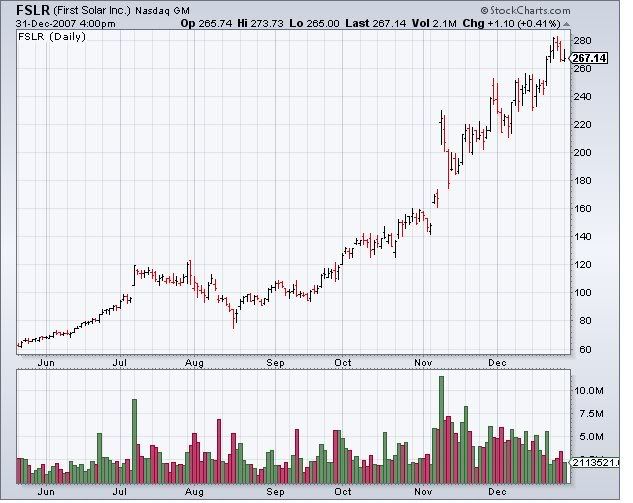
Another thing to note is just how over extended growth charts can look before they take off. Note again FSLR. Below is a before and an after chart that, in my mind, shows that you just don't know until you know and there's no way to predict which breakouts to all time highs are going to turn into parabolic lift-offs.
Before:
After:
Thanks again for your posts and insight, fpetry. They are very much appreciated. As is your knowledge of momentum trading.
Check earnings date...on the list! I will post again after checking the Darvas book.
David John Hall
|
|
Registered User
Joined: 6/6/2005
Posts: 1,157
|
I think it's important to reiterate that this trade, even with it's resulting massive loss, only resulted in a 2% hit to my trading capital. Because my stop at the time of the trade was just under the low of the box, or the 1/2 way point of the channel at $24.10, I factored in that to the position size.
$24.10 was 22% away from my entry of %31.14. I devided 2% of my total capital by 22% and devided that number by the breakout price and arrived at the number of shares to buy. It was a very small buy in but using the chart, and the current level of volatility was a smart thing to do and one reason I didn't spend the weekend curled up in a ball on the bathroom floor when price began sliding after hours. Granted there was a little slippage this morning, but nothing outside the norm.
I reiterate position size here, because it's something I never paid much attention to. There's a great book out there called The mathematics of Money Management by Ralph Vince that states you should always begin your position sizing with the worst case scenerio in mind, and a plan of action regarding what you would do should this occur.
Backtesting these set ups this weekend let me know that this is just about the worst case scenerio for this type of trade. there were a few gaps at 50%, but most were in the 20-30% range.
David John Hall
|
|
Registered User
Joined: 12/2/2004
Posts: 1,775
|
Good point there David about never knowing when the trend will end and how extended stocks can just keep going up. I guess the main point I wanted to get across is that I don't think it's a good idea to buy or keep adding to a position that's in a third of fourth stage base (as explained by O'Neil) and trading more than double above its 200-day moving average. The key to Darvas's success I think was mostly buying in at an early stage and adding on early as price proved itself. But like you say he may have added on much higher when already up huge in some instances...I have the book too but I'll let you do the research:) O'Neil by the way is a Darvas fan and was heavily influenced by him, and I like O'Neil's method because he expanded on what Darvas did and his reasearch refined the technique to a high degree. One big difference between Darvas and O'Neil...Darvas defined a box as forming just a week or 8 days, while O'Neils shortest box/base is 5 weeks.
Dont feel bad about earnings date miss, I've been there done that:) Just recently I bought a stock breaking out of a base and as my eyeballs saw dollar signs in the breakout it caused my discipline to slip as I quickly bought without also checking its most recently reported short percentage. It was a whopping 42%....my rule has always been to avoid buying such a heavily shorted stock. The breakout of that stock, OTEX on 4/16, failed soon after and I was stopped out. It's since recovered but I don't trust it....no edge for me anyway as I'm thinking the recent buying may have been significant short covering but not near enough to purge the huge short position; no real accumulation by funds/institutions.
You are on the right track as it's apparent you are really taking seriously money mangagement technique. My trading didn't really improve until I became much more disciplined in that area. Whereas you stopped out on GENC today, if it had been me a few years ago I would have been the deer frozen in the headlights and too stunned to do the right thing.
|
|
Registered User
Joined: 6/6/2005
Posts: 1,157
|
Excellent point about the 5 week base fpetry! Does Oneil have a suggested depth for the base? So that would be a break of the highest high over a 100day period? I was experimenting with longer period before breakout this weekend and found them more favorable as well.
GENC has a short percent of 1.73% of it's float -- however, today it had an increase of 367%! In they pile. And I think you also have a very good point about the extend and volocity of GENC's prior move, being up 200% in a few short weeks. I'll get back to you on the darvas research.
David John Hall
|
|
Registered User
Joined: 12/2/2004
Posts: 1,775
|
QUOTE (davidjohnhall) Excellent point about the 5 week base fpetry! Does Oneil have a suggested depth for the base? So that would be a break of the highest high over a 100day period? I was experimenting with longer period before breakout this weekend and found them more favorable as well.David John Hall
Yes, O"Neil is very specific. Depth of flat base no more than 12-15%, high to low, and for a cup/handle base, length is minimum of 7 weeks, with max depth of 35%, though he allows for a bit more depth during a major market correction like we've had past few months, say 40-45%. The break would bet the break above the high of the flat base. The high in the base therefore could be located any where within the base. See the high in the flat base I just posted on BKC for good example of a flat base per O'neil. You should read his book, How to Make Money in Stocks, good companion to the Darvas book. Looking forward to your Darvas research.
|
|
Registered User
Joined: 12/2/2004
Posts: 1,775
|
I forgot to mention, in any O'Neil early stage type base you wuold be buying from, the highs of the base have to be within close striking range of either all time or one year highs, around 17% or less. therefore in the BKC example, if price breaks through 29 on good volume but year highs from just a few months ago were 50, it would not be a proper base to buy from.
|
|
Registered User
Joined: 6/6/2005
Posts: 1,157
|
hey fpetry,
Looks like Darvas more or less did not have a problem buying extended stocks. A couple were bought at early stage breakouts, but were already up 100% at the time of his buy. Lorrilard, Diners Club (split adjusted) but others were up 200-300% in parabolic uptrends: EL Bruce, Thiokol Chemical, Texas instruments, fairchild camera. Actually, the more I look at these charts the more I would have to admit that even I would think they're overextended.
You are correct though, he did complete his purchases (usually three) within a very short period of time and then he would hang on as long as new, higher boxes were being formed.
One of them, EL Bruce more than doubled after he bought it because of the massive short interest and the scramble of shorts to cover.
Fairchild camera he bought at $128 after it had run up from $20.00 in less than a year offering 3 prior buy points at $30, $60 and $90.
Very interesting.
David John Hall
|
|

Registered User
Joined: 4/18/2005
Posts: 4,090
|
There is a company that sells a "darvas" type trading strategy and I would swear that they make Up 100% at current time a prerequisite. Stocks that go up 200 - 500% must go through 100% to get there (unless they gap)
I think David John Hall knows somethign about them.
|
|
Registered User
Joined: 12/2/2004
Posts: 1,775
|
David, great report on details for some of Darvas's high flying winners, thanks.
|
|
Registered User
Joined: 6/6/2005
Posts: 1,157
|
You're welcome fpetry. It's interesting to say the least. Darvas certaily was agressive but methodical. The masters like Oneil and Darvas and the Turtle crew are certainly worth studying. But, i think you're right, adaption and evolution of the systems and approaches is key in an ever changing market. Thanks for the great discussion.
David John Hall
|
|
Registered User
Joined: 11/11/2006
Posts: 359
|
Daryl Guppy "Trend Trading" (2004) gives quite a lot of his book over to Darvas methods. Included are the traditional methods as well as some more current applications. For instance, volume is completely disregarded in decisions to buy/sell. Guppy feels that, in the time of Darvas, volume was important because it was quite small compared to today.
Watch lists were composed of 52 week highs, which had a success rate of about 80%.
Those lists with 26 weeks high was in the neighbor hood of 70%, which was still acceptable.
It was found that using three month highs as a watchlist dropped the success rate to 50/50---60/40 and was not a worthwhile pursuit.
Mammon
|
|
Registered User
Joined: 12/2/2004
Posts: 1,775
|
QUOTE (mammon) For instance, volume is completely disregarded in decisions to buy/sell. Guppy feels that, in the time of Darvas, volume was important because it was quite small compared to today.Mammon
mammon, if I follow correctly, Guppy disregards volume in his trend following method? The turtle rules disregard volume, but William O'Neil is totally opposite as he places very strong emphasis on volume in current environment. There's more than one way to skin a cat, and I think the important thing for all traders is to find a system/method/rules that works for them over time, and have the disicipline to stick with the method. But nothing wrong with tweaking as one evolves as a trader, just no sudden discretionary reaction such as what I used to be guilty of.....pulling a stop as price neared it, hoping price would reverse in favored direction.
|
|
Registered User
Joined: 6/6/2005
Posts: 1,157
|
Hey mammon,
50/50 and 60/40 can be worthwhile if the winners are at least double the losers and are added to correctly. But I like the idea of 80% success rate very much. Over the past few months I've been backtesting all variations of breakouts. Price levels. Etc. I've never been able to get a breakout system above 60%. Interestingly, or not, the lower priced breakouts seem to score the best. meaning new all time or 52 week highs at lower prices.
Also, watchlists of higher beta stocks score well. If I think about it, these stocks because they show greater volatility, should have larger price swings in each direction.
But I'll have to give Mr. Guppy a read. I also read something interesting in Active Traders magazine, that one way to enhance system performace is to apply a moving average to the system's equity curve.
For instance, in all of my backtesting I have begun to see (at least with trend trading) a heavy market correlation. Peaks in 2000, drawdown to 2003, run up to Oct 2007. Currently, all breakout systems are in drawdown mode. The drawdowns closely mirror the S&P500 crossing above and below it's 200 day MA. Might be something to consider.
Either trade breakouts stocks not market correlated or refrain from breakouts while market is below the 200 day MA. More research is needed.
David John Hall
|
|
Registered User
Joined: 12/2/2004
Posts: 1,775
|
QUOTE (davidjohnhall) 50/50 and 60/40 can be worthwhile if the winners are at least double the losers and are added to correctly. But I like the idea of 80% success rate very much.
David John Hall
Many of the greatest traders I've ever read about never had a success rate over 50%, most tended to have about a 66% failure rate, 33% win; one I forget had less than a 20% win rate but was among the elite of successful traders. The turtles had a high-failure/low-win rate and made spectacular gains most years. It's all about risk management, position sizing, the old tried and true starve your losers , feed your winners dance. For an easy example think of nine consecutive losses of 2% each, then one winner 50%+ scenario, with most of the losers being smallish starter positions, the one big winner naturally fed into a full position as it advanced. That's how the turtles did it basically. They would initiate a new poisition by buying a single unit or piece and sell that one unit for very small percentage loss if it went south and triggered its stop, but if it advanced they would add as many as 4 or 5 new units into a full sized position, moving the stop up along the way at each new buy and then if the trend took off that's when it more than made up for the numerous small losses. Do that over and over, and compounding, big bucks via high loss trading rate is quite common among seasoned successful traders.
|
|

Registered User
Joined: 10/7/2004
Posts: 2,181
|
Here are some additional thoughts on this run-up. I was not in GENC, but here is how I would have played it based on the system and approach that I use.
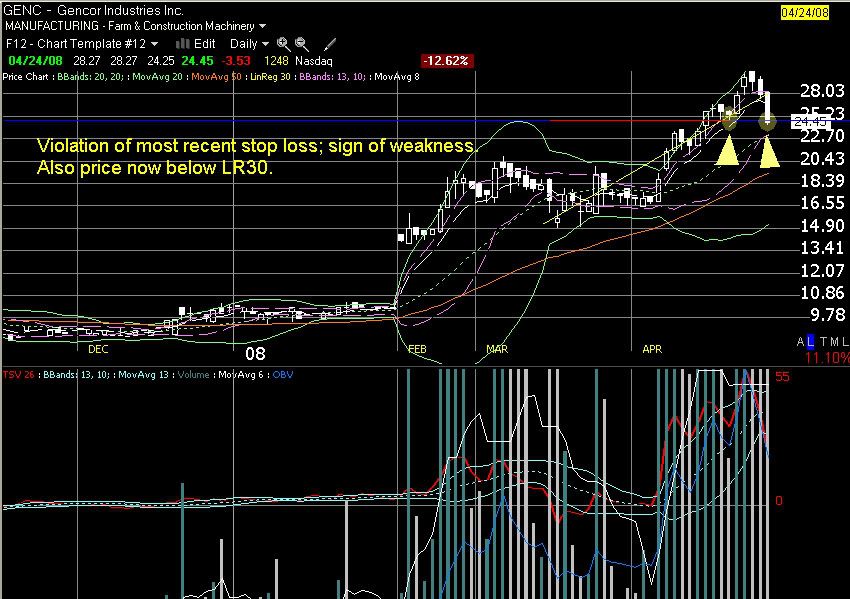
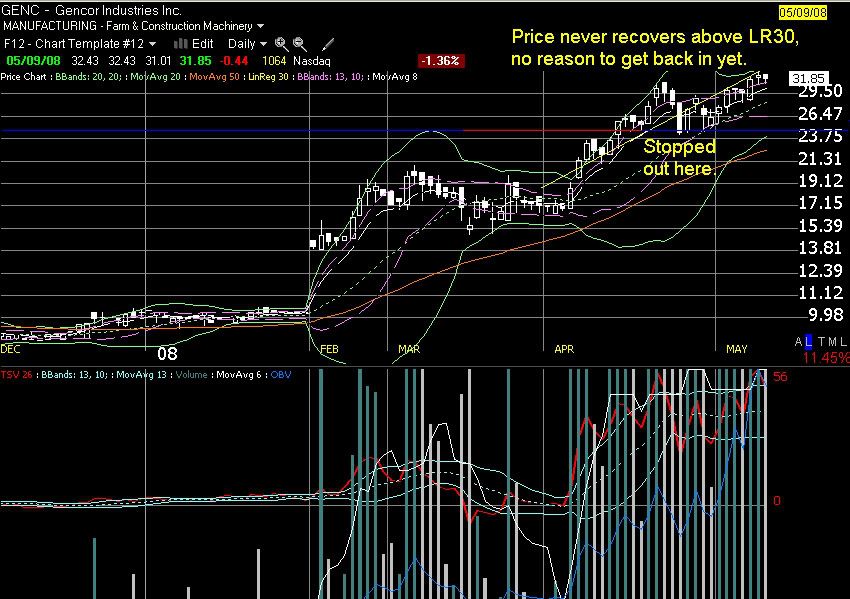
I think the pics make it clear, especially for those that understand the role that LR30 plays in my trading style.
Thoughts welcome.
|
|
Registered User
Joined: 10/7/2004
Posts: 2,181
|
Sorry, Pic1 is the buy signal. TSV26 over bb13 and 0 line, LR30 support (reasonably so anyway) and nice volume boost.
|
|
Registered User
Joined: 6/6/2005
Posts: 1,157
|
looks nice, tobyday... i like your use of the LR30. Does a break up above the LR30 constitute a buy signal to you or do you only look for buys signals in stocks already trading above this area?
David John Hall
|
|
Registered User
Joined: 10/7/2004
Posts: 2,181
|
http://worden.com/training/default.aspx?g=posts&t=30865
David, this thread explains my buy signal.
thanks
|
|
Registered User
Joined: 11/1/2005
Posts: 240
|
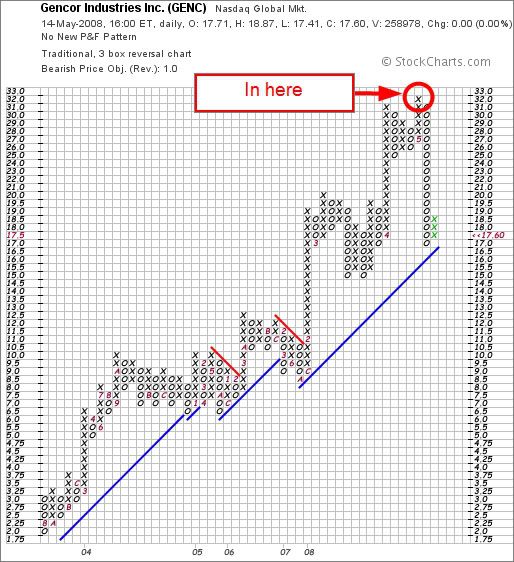
David,
are you familiar with p&f charts. the up side count in the top pink rectangle was used up at the top of the rectangle. the p&f charts are reasonable easy to learn. there is a upside objective, some call it a up side target. (low, medium, and high)when it is reached the stock dosen't move too much above the objective. in a strong mkt, it can move above the objective, it a weak stock it may not reach the objective high. its worth looking at.
|
|
Registered User
Joined: 6/6/2005
Posts: 1,157
|
hey jimstacy,
Funny you mention that as I'm half way through The Definitive Guide to Point and Figure charts. Surprisingly, I did consult the p&f chart on this one and bought on the double top break. I was weary of the distance to the trendline and must have missed the target - stockcharts usually lables it.
I've reviewed this trade quite a bit and agree with you that in this skittish market environment it was an optemistic maneuver at best on my part to expect more upside. I'll have to chalk it up to a great learning experience.
Here's the p&f for anyone who's interested:
|
|
Registered User
Joined: 11/1/2005
Posts: 240
|
the author is speaking at Golden Gate University monday the 19th. I went through the book a couple of times, its different than the course I took. same with stock charts, Dorsey has a online class, its complacated, I don't want to create any unnessary thinking. there is a simpler way, most don't write about it. some of these writers write only and may not understand how to use the information they write about? :)s some what like a book review in 5th grade. I'm going to the class, I wonder if Americans can understand real English? :)s I'll find out.
|
|
Registered User
Joined: 6/6/2005
Posts: 1,157
|
I'm all ears. Is there a site or a book devoted to the simpler way or is it something you've put together over the years? Any info would be appreciated. Thanks!
David John hall
|
|
Registered User
Joined: 11/1/2005
Posts: 240
|
Market charts on line keeps the correct charts. my learning was in the wyckoff course. it was basic, they recommended chartcraft to do furthur study. I don't know if they are still around.
the basic difference, if the price should drop to 40 from 42 and back to 41 than to 40 its all recorded. most only use one 42 drop price. the base is divided in to steping counts. this may be programable in blocks. it works intra day also. its a good guide line to project prices. than like all charts watch the volume to know when to get in or out. and keep up your indicators you are comfortable with.
|
|
Registered User
Joined: 9/30/2006
Posts: 34
|
David. A few more points on Darvas.
He liked bull markets with a good selection of rapidly rising stocks.
He was interested in maximum growth. "This being the case, it seemed only logical to choose those stocks that had already showed what they could do by actually doing it."
He wanted "stocks not merely rising in price, but actually in their highest boxes ever."
His potential buys had to have at least doubled within the last year.
He was very aware of the "rhythm of a stocks advance" eg1 "….and sold at 85.5 when it failed to move up through the new box as quickly as I thought it should."
Eg2 … the stock suddenly seemed to darvas to have "lost its will to rise …. It almost seemed ready to tumble."
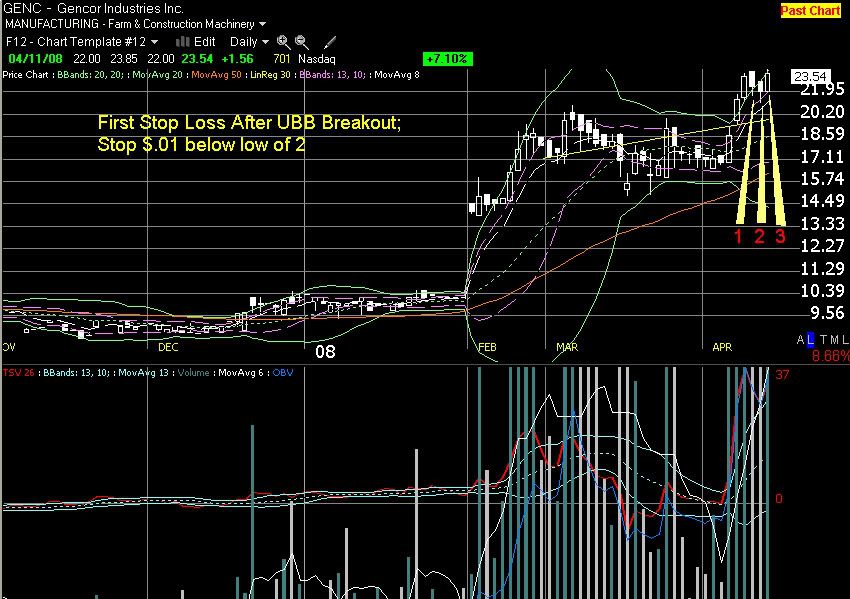
He doesn't say it specifically but its implied that he had 2 different stop loss positions.
1) When he does a small pilot buy into a new stock that has just broken out of its highest box. He does this with a buy on stop, at a price just fractionally above the high of the old box, and then places a stop, just fractionally under this high. This way he only loses about 1 or 2 percent, including commission.
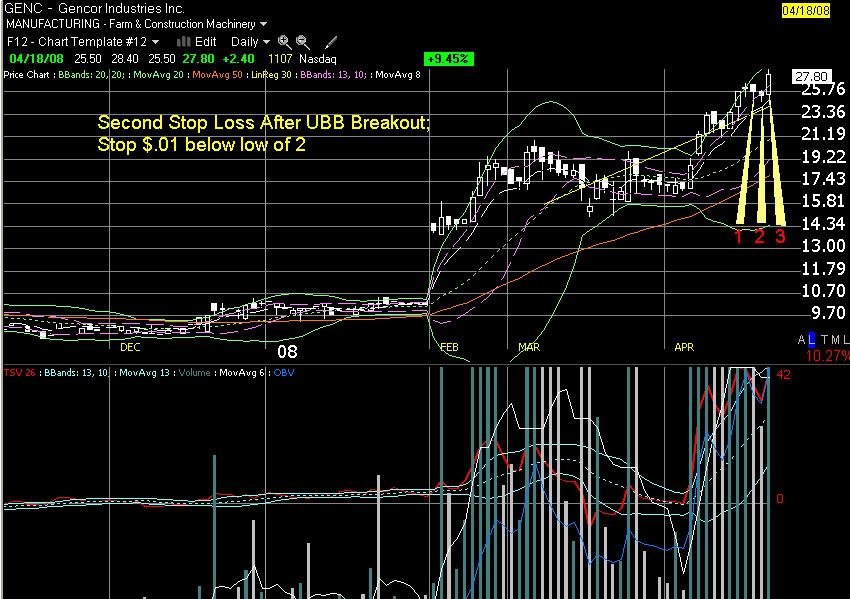
2) If the stock keeps running up, into higher boxes then he will move the stop upwards, to just under the bottom of these higher boxes.
He was prepared to be stopped out a few times, and buy back in, if the stock was otherwise behaving itself. After all he is only losing 2% of a small position each time.
He was very aware of keeping commissions down, as they were very high in his day. "I buy the most expensive stock I can afford, and I buy it in round lots."
|
|
Registered User
Joined: 11/1/2005
Posts: 240
|
David,
the book is more for soft ware, developed by the author. I'm have more of a short term interest useing personal judgement.. it works for difference interests.
|
|
Registered User
Joined: 11/1/2005
Posts: 240
|
Phases instead of steping counts, the phases should represent the steping stone counts that become the up trend. each steping stone up should be found in the base, marked off as phases in the base, to project the up side count of each phase. had to clear that up, this means you are more confused?
QUOTE (jimstacy) Market charts on line keeps the correct charts. my learning was in the wyckoff course. it was basic, they recommended chartcraft to do furthur study. I don't know if they are still around.
the basic difference, if the price should drop to 40 from 42 and back to 41 than to 40 its all recorded. most only use one 42 drop price. the base is divided in to steping counts. this may be programable in blocks. it works intra day also. its a good guide line to project prices. than like all charts watch the volume to know when to get in or out. and keep up your indicators you are comfortable with.
|
|
|
Guest-1 |