Registered User
Joined: 11/11/2006
Posts: 359
|
Tobydad: It seems that your Profile has grown since I last upgraded your template.
In addition, It seems that you are not pulling your recent candidates from the time honored ROLLING STONES or the Against the Grain scans.
You had mentioned starting another thread to include your new concept for finding "20%'ers".
when you do this, in addition to your home schooling, housekeeping, baseball and football coaching, car washing, floor moping, etc, could you take a few extra minutes and catch us up on any additions you may have made,in form or concept, to your strategy?
I thank you,
Mammon
|
|

Registered User
Joined: 10/7/2004
Posts: 2,181
|
Well, just remember, you asked for it!
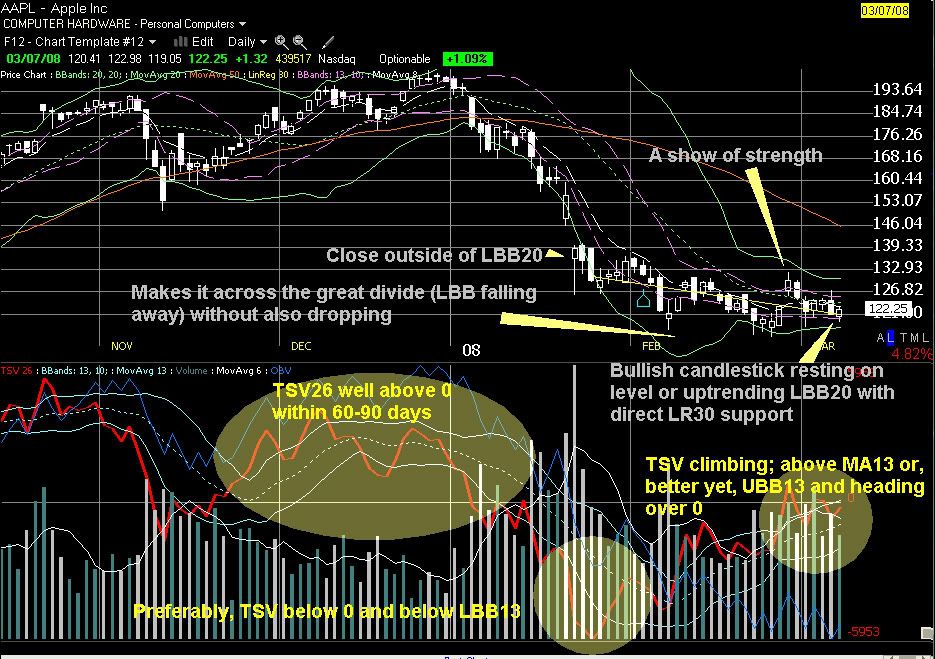
AAPL is a very good example:

From here, the safeguard is to use what I call a CBO1 (conditional buy order 1 penny over HOD or high of day). For newer traders, the conditional part is important, everyone can see your buy stop order and will simply go grab it...then let the price drop if it's going to do that. With the conditional, I'm only getting in if the price is truly moving in that direction.
As to recent candidates, yes, I'm looking for a little more confirmation in this market. Although, after today's action, it looks like the next few weeks might be good ones for the stocks playing dead but geting quiet accumulation.
More to come, tired now.
Blessings all.
|
|

Registered User
Joined: 4/18/2005
Posts: 4,090
|
what is the difference between a conditional buy order and a buy stop? I thought it was the same.. but aparently not.
are you buying at market based on an alert when somethign happens?
|
|

Registered User
Joined: 10/7/2004
Posts: 2,181
|
Scott,
just to bring closure to your question and for the benefit of others: from my experience, conditional orders are th only way to go. In fact, with my style of EOD, buying only if price exceeds high of the previous day triggering, conditional orders are a must in even selecting a broker. I just can't use a broker that doesn't offer it.
That said, a conditional order, as I'm referring to it, is basically a limit order or market order that your broker holds for you based upon conditions that you establish. A buy stop can be seen by the markets and other traders so, if desired, some traders have the ability to snag your order which, in many cases, simply makes your buy the high of the day but not a high that would have happened anyway.
Now, as to this thread, since bcraig has asked about the Tobydad profile as well, shall we all just move over to that post for my response? thanks
|
|

Registered User
Joined: 4/18/2005
Posts: 4,090
|
Really ? ? I've never realy had a problem with it? I had a stop order over DUG three days ago.... that would have been easy money to hit.
I have had trades where I was the high but I've also not entered orders that I calculated but pulled at the last minuite and found that price would have triggered the order any way.
Interesting. I know that my broker offers conditional orders but i've never used them.
|
|
Registered User
Joined: 7/21/2007
Posts: 188
|
QUOTE (tobydad) Well, just remember, you asked for it !
AAPL is a very good example:  From here, the safeguard is to use what I call a CBO1 (conditional buy order 1 penny over HOD or high of day). For newer traders, the conditional part is important, everyone can see your buy stop order and will simply go grab it...then let the price drop if it's going to do that. With the conditional, I'm only getting in if the price is truly moving in that direction. As to recent candidates, yes, I'm looking for a little more confirmation in this market. Although, after today's action, it looks like the next few weeks might be good ones for the stocks playing dead but geting quiet accumulation. More to come, tired now. Blessings all.
Tobydad, your analysis is so complicated. My eyes are glazing over. I scanned Bollinger's book on Bollinger bands and I must confess, it was over my head.
Jim.
|
|

Registered User
Joined: 6/6/2005
Posts: 1,157
|
Hey JZ,
Maybe I can help, by breaking down a few of these concepts. I don't trade the tobydad profile per se, but these are some of the types of stocks I like to look at.
If tobydad doesn't mind I thought I'd take the same chart and remove a few items in the interest of discussion and helping to clarify what some of the tools are used for...
Here's the same chart with a few items missing...

When it comes to any tool you want to know as best as we can, WHY the creator designed it. From what i have read, John Bollinger created Bollinger bands because he wanted something better than price channels -- price channels PLUS if you will.
Instead of knowing the highest high and highest low over a certain period, Bollinger was more focused on relative price moves and volatility. How is price moving now, compared to how it was moving a few periods back.
He wanted to know this because he knows markets move from volatile periods to quiet periods and when price has maxed out volatility-wise in one direction it will often snap back. One way to tell this maxed out period is when the bands become very wide and we see a close outside the band as Tobyday highlighted.
60-70% of the time, volatility will contract when this happens.
So when we have that close outside the band, that's a FLAG -- and it says: hey, price MIGHT be getting ready to snap back here.
Now tobydad wants to look for other ways to confirm this possible FUTURE price action.
By looking at recent TSV movement he might get an idea of accumulation taking place. That's why he wants TSV (which remember stands for time segmented VOLUME) is on the rise. If price is falling and TSV is rising, this indicates a DIVERGENCE and tells us all is not as it appears.
In simple terms, price is attempting to FOOL those that might be not be as aware of what's going on behind the scenes.
If price is falling and someone is buying, maybe someone and someone BIG thinks this is a bargain.
Now, Tobyday is not content enough to jump in on these facts alone. He wants to see price CONFIRM his idea first. So when we get that nice POP above the YELLOW linear regression line it indicates that his hypothesis may be correct -- there is some buying activity below the scene.
When price trades slowly and evenly back Tobydad has the final piece of info he needs. The waters are calm enough to take a position if price can trade back obove the high of his signal bar.
He has his set up, his entry trigger and he will have his stop (which is probably the March lows) all neatly laid out for him. You couldn't ask for anything more from a good system.
1. It tells him when to put a stock on his radar.
2. It conforms when he's right by proving itself.
3. It tells him when to enter and where to place his stops.
4. And, if what I know about these stocks is true, it gives him the EDGE he needs to make a profit over time (not every time)
Hopefully I have added to this discussion and not subtracted from it.
David John Hall
|
|

Registered User
Joined: 10/7/2004
Posts: 2,181
|
David;
Superb! Thank you so much for your time contributed and timely contributions!
Oh, and Merry Christmas!
|
|
Registered User
Joined: 7/21/2007
Posts: 188
|
Merry Christmas All !Thanks David for your explanation. Could you clear up one item? What is the difference between Volume and Time Segmented Volume? I've never gotten that right. Jim.
|
|

Registered User
Joined: 6/6/2005
Posts: 1,157
|
Thank you Tobyday, Merry Christmas to you as well. hope you had a fantastic one!
Hi Jz,
You're welcome. Time segemented volume is proprietary to the Wordens and so the formula isn't disclosed. However, if you break down the name you can get an idea:
Time: an indefinite period (usually marked by specific attributes or activities
Segmented: separation by the creation of a boundary that divides or keeps apart
Volume: a relative amount
So it looks like we have volume seperated or measured by time. So it may be some time of moving average of volume over a certain period of time.
Here's what investopedia says about it:
A technical analysis indicator developed by Worden Brothers Inc. that segments a stock's price and volume according to time intervals. The price and volume data is then compared to uncover periods of accumulation (buying) and distribution.
|
|

Registered User
Joined: 6/6/2005
Posts: 1,157
|
That was supposed to read "some TYPE of moving average" rather than some TIME of moving average".
|
|
Registered User
Joined: 7/21/2007
Posts: 188
|
Hmm. Stills sounds pretty vague. Thanks, David.Jim.
|
|

Registered User
Joined: 6/6/2005
Posts: 1,157
|
Hey Jim,
Welcome to the world of proprietary indicators. I personally don't use TSV but others are comfortable due to their experience and success with the indicator. All i can say is try using both volume and TSV and determine if either works for you. There are other volume based indicators like OBV (on balance volume) that you can also use.
Good luck.
David John Hall
|
|
Registered User
Joined: 7/21/2007
Posts: 188
|
I've read that volume has become less significant with the rise of flash trading and dark pools. I personally don't like proprietary indicators either.Jim.
|
|
Registered User
Joined: 1/28/2005
Posts: 6,049
|
"I've read that volume has become less significant with the rise of flash trading and dark pools."
=================================
Cant ask for any more convincing proof than that.
Thanks
diceman
|
|

Registered User
Joined: 6/6/2005
Posts: 1,157
|
LOL very true, diceman.
Jim,
I think that you should judge the significance of volume based on your results while ignoring compared to your results while using it. I am currently in the process of doing the same. I have a set of charts that has no volume on them. Only price and the trend following indictors I use. For some reason my brain really wants to see the volume on there. And I really can't tell you why. The chart just feels more complete though I rarely use volume for my decisions.
|
|
Registered User
Joined: 7/21/2007
Posts: 188
|
OK. Thanks.
|
|
Registered User
Joined: 2/21/2007
Posts: 797
|
Jim: Try adding to T.D.'s or D.J.H.'s chart a second bollinger band. David uses 20/20, 20 period, 2.0 width. My buddy Mark Deaton, I'm sure that he won't mind, thanks Mark, he got me at 21/20, no big difference to David, but what Mark suggested was to add another band at 21/30. I think if you scan a bunch of charts, you will find if price hits the 21/30 B. B., price is ready to change direction. Anyway it gives a good picture.
|
|

Registered User
Joined: 4/13/2009
Posts: 122
|
tobydad,
just a quick question,and you may have included it before, but what do you look for in volume? Do you have a min that you look for when using a scan?
Thanks
tiger1220
|
|
|
Guest-1 |