| Welcome Guest, please sign in to participate in a discussion. | Search | Active Topics | |

Registered User
Joined: 10/7/2004
Posts: 2,181
|
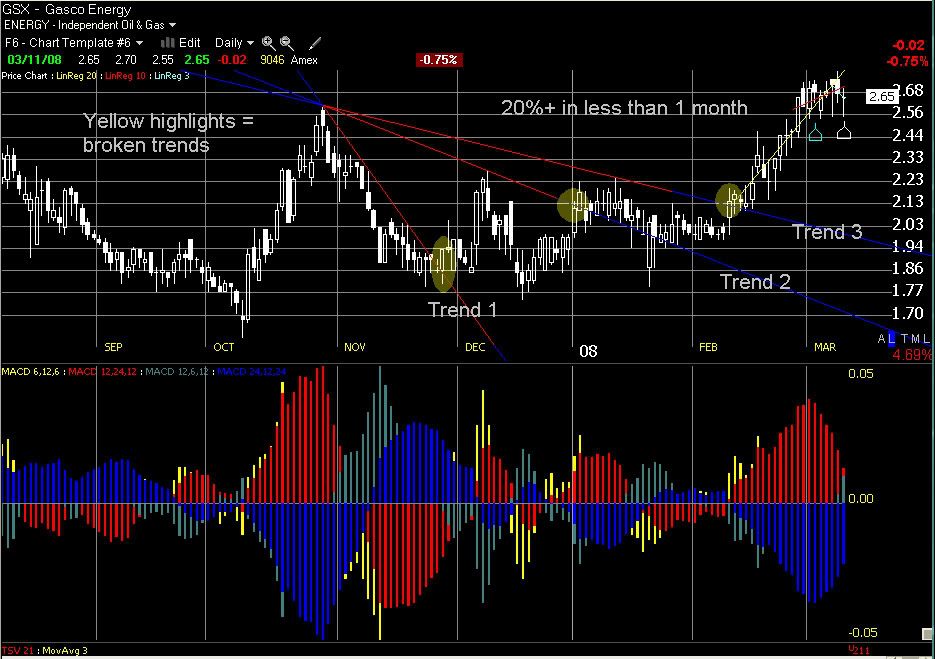
These suggestions are not to replace any techniques. This is just a quick visual confirmation system that you can develop with very little practice. It can be used on any time frame. In a relatively short period of time you'll find yourself not having to physically draw the lines.
You can also see a nice W pattern there Nov - Dec.
Of course, always keep all the other rudimentary technical analysis in place; be sure you're looking at healthy sectors, keep fundamentals in mind, etc.
The process is, essentially, nothing more than spotting new trends being repeatedly broken to the upside. This is always a good indicator of a stock building steam for a nice move.
I believe the pic below will tell it all.
Happy hunting!
|
|
Registered User
Joined: 9/25/2007
Posts: 1,506
|
Great post tobydad ...

|
|
Registered User
Joined: 1/28/2005
Posts: 6,049
|
Have not seen the "quad MACD" in a while.
Thanks
diceman
|
|
Registered User
Joined: 3/14/2005
Posts: 25
|
tobydad: could you give me a quick lesson on the quad MACD, yellow seems to be the key!
lynn
|
|
Registered User
Joined: 10/7/2004
Posts: 2,181
|
There's really not much magic here, and I don't use these as a primary indicator. We're simply looking at two indicators (one fast and one not-so-fast) that move above zero during accumulation and price increase and two that move above zero during distribution and price drop. Of course, the opposites are true as well. The color choices simply remind me of cool and cold colors and warm and hot colors respectively.
So a burst of yellow is a good indication of a possibly price move up. If that "warm" yellow is joined, or better yet, overtaken by the "hot" red, while the cool and cold colors move downward to confirm, then we know there is a good chance of a move in a favorable direction.
Again, not much magic, setting it up on one of your tabs and back-scrolling through a bunch of your favorite stocks should give you the practice you need. (And will explain better than I am able.)
|
|
|
Guest-1 |