| Welcome Guest, please sign in to participate in a discussion. | Search | Active Topics | |
Registered User
Joined: 12/6/2004
Posts: 48
|
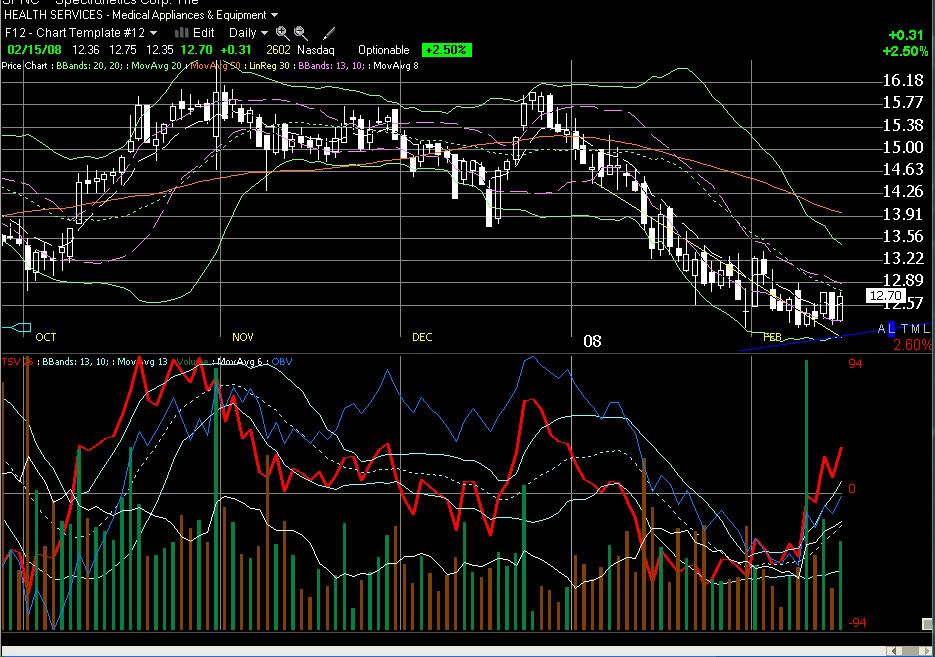
SPNC -- Spectranetics -- is a medical device manufacturer. They make microlasers that used to unclog leg and heart arteries, as well as specialized equipment to remove pacemakers when the patient needs a new one.
Company reports 2007 earnings on Wednesday Feb 20. EPS of 5 cents per share expected. Growth is hitting the sweet spot -- analyst just raised 2008 earnings from 0.19 to 0.20 share. Average analyst price target is $17. Forward P/E ratio is 63 -- sky high, but that's a good sign for a growth stock. People see growth ahead and are willing to pay for it.
On the chart, the stock has stopped going down at around $12.50. Stochastics, TSV, OBV are all turning up. It appears the stock was under heavy accumulation on Feb. 11 on 3x normal volume. I think the chart is trying to make an ascending triangle, with $12.50 as a major low and will rise to retest the $16 resistance for a third time.
I think this one is fairly risky so do your own due diligence. I'm going to grit my teeth and hold through earnings. Disclaimer: I'm long SPNC at $12.41.

|
|

Registered User
Joined: 3/21/2006
Posts: 4,308
|
I like this one as well. On your chart you have highlighted all the important issues eccept support resistance and stop loss, wich I have added to my chart. If the markets continue to fall then I would sell at the stop loss that I have high lighted if I were you. It will be a low risk situation, that is the reason that I like this one. I might enter myself if price can break the resistance at around $14.00
Good luck
Apsll.

|
|

Registered User
Joined: 10/7/2004
Posts: 2,181
|
This one looks great. I don't see this as a risky move at all; at least not based on the charts. Nice call, NutOnABike. (By the way, what do you ride? I love motorcycles!)
This fits my scenario perfectly.
The other beauty of this is that it's sitting right on the supporting trendline. To see it come back to an established trendline and then fit the tobydad profile, wow, just great.
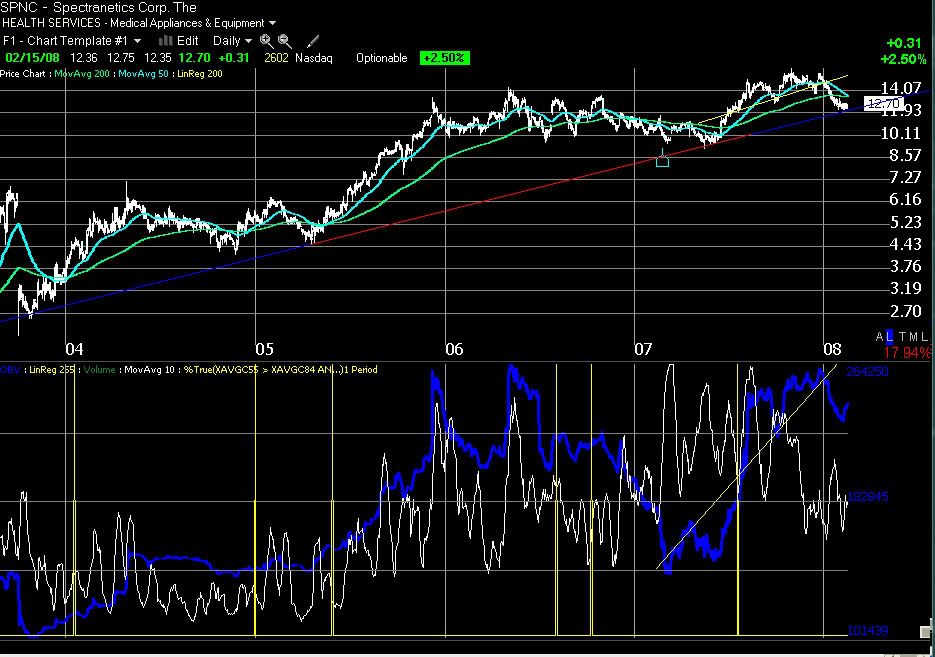
It's already given a good buy signal so at this point I'm going to buy as close to the LBB20 as possible. I'm in.
|
|
Registered User
Joined: 12/6/2004
Posts: 48
|
QUOTE (tobydad) This one looks great. I don't see this as a risky move at all; at least not based on the charts. Nice call, NutOnABike. (By the way, what do you ride? I love motorcycles!)
Thanks Tobydad and good luck on your trade. I ride bicycles :-). I do most of my commuting to work by bike. Actually, I like to think bicyclists and motorcyclists are a part of one big two-wheeled family. We both face the same peril on the road: careless cars, trucks and buses. Be careful out there, ride safe.
|
|
Registered User
Joined: 12/6/2004
Posts: 48
|
QUOTE (Apsll) I like this one as well... I might enter myself if price can break the resistance at around $14.00
Thanks, glad you like the chart. As far as buying above $14, that's fine if it works for you. I understand and respect that strategy but I've never been a fan of it. When I've done that I always feel like I've missed half of the parade. Or, if I chase a breakout it pulls back on me and I end up holding through a drawdown.
|
|
Registered User
Joined: 12/6/2004
Posts: 48
|
OUCH. Down -28% today. Earnings came in breakeven $0 vs. $0.02/qtr expected.
Play with fire and you get burned. I know holding a small cap through earnings announcements is risky business. That was dumb. Revenues growing at 35% per year, how could I be wrong? Easy. I was wrong.
Should I keep it and hope for a better quarter or a buyout? Company guidance says revenue growth will continue, and should be 20% higher for 2008Q4. But in today's news release the company declined to give EPS guidance. If the company's not confident whether or not they can be profitable, neither am I. The chart is now a technical disaster. I'll just take my loss and move on.
|
|
|
Guest-1 |