
Registered User
Joined: 6/6/2005
Posts: 1,157
|
Earlier today I got to thinking (never a good thing) about a topic that has been brought up a bit lately; namely the forward performance of the top 5 stocks in an index (for me -- the Russell 1000) versus the forward performance of the bottom 5. I decided, once and for all, to put the matter to bed (for myself) and set myself into a gargantuan mission. I have started with the year 2006 (2007 isn't finished yet) and will be working back 10 years and for each month i will determine the 1 month forward performance of each stock in the top 5 and bottom five of the prior month. Hope that makes sense!.
To create the test I did a custom date sort of January 2006. I then took the top 5 percentage gainers and the bottom five and flagged them. i then opened the "all flagged items" watchlist and ran a custom date sort going forward one month to see how they faired. To say the least, it was amazingly interesting. When I started out, I also included the middle 5 -- but trust me, nothing even close to anything happened in those stocks so I gave up. I will be staying away from all stocks in the middle from now on.
Maybe one day I will list the exact stocks that were the top 5 and bottom 5, but right now I will only list the cumulative totals and the average of the 5 which is enough work in and of itself. One very interesting thing to note is that for each month, nearly every month, the highest gainer was around 30% and the biggest loser was around -30%. Very interesting.
To begin with, here is a chart of how the Russell 1000 looked through 2006.
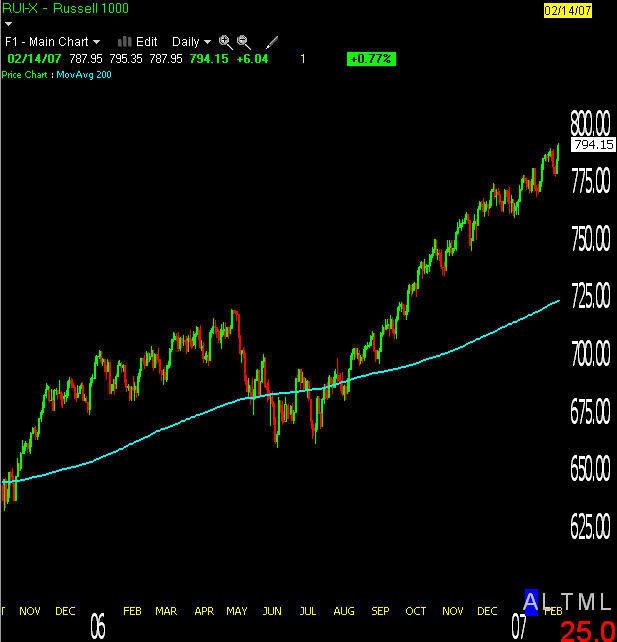
And here is how it performed:
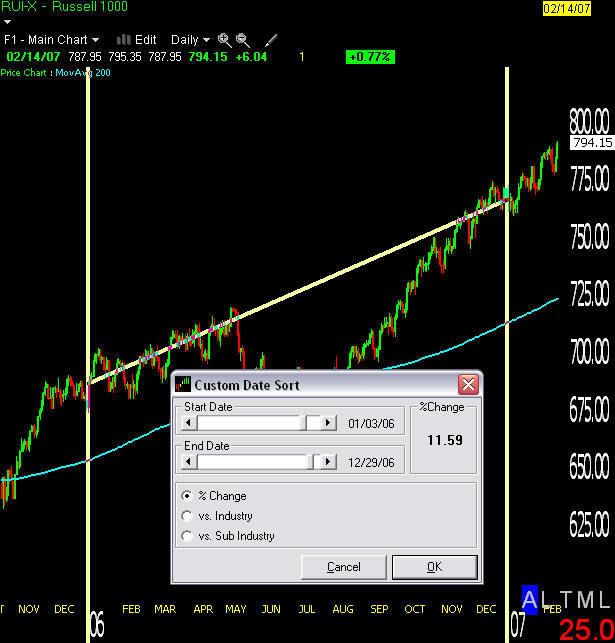
And finally, without further delay, here are the numbers...
January (this means the FEBRUARY performance of the top 5 January stocks)
Top 5
Cumulative: -4.53%
Average: -.90
Bottom 5 (this means the FEBRUARY performance of the bottom 5 January stocks)
Cumulative: 11.11%
Average: 2.22
February
Top 5
Cumulative: 28.33%
Average: 5.66
Bottom 5
Cumulative: 58.39%
Average: 11.67
March
Top 5
Cumulative: -1.94%
Average: -.38
Bottom 5
Cumulative: 25.61%
Average: 5.12
April
Top 5
Cumulative: -6.48%
Average: -1.29
Bottom 5
Cumulative: 7.05%
Average: -1.41
May
Top 5
Cumulative: 6.55%
Average: 1.31
Bottom 5
Cumulative: -41.64%
Average: -8.32
June
Top 5
Cumulative: -19.52%
Average: -3.90
Bottom 5
Cumulative: -46.07%
Average: -9.21
July
Top 5
Cumulative: 34.24%
Average: 6.84
Bottom 5
Cumulative: 35.42%
Average: 7.08
August
Top 5
Cumulative: 20.25%
Average: 4.05
Bottom 5
Cumulative: 27.63%
Average: 5.52
September
Top 5
Cumulative: 23.80%
Average: 4.76
Bottom 5
Cumulative: 73.29%
Average: 14.65
October
Top 5
Cumulative: 58.01%
Average: 11.60
Bottom 5
Cumulative: 55.84%
Average: 11.16
November
Top 5
Cumulative: 7.85%
Average: 1.57
Bottom 5
Cumulative: 19.81%
Average: 3.96
December
Top 5
Cumulative: 19.77%
Average: 3.95
Bottom 5
Cumulative: 52.63%
Average: 10.52
Total Cumulative Top 159.60
Total Average Top 13.30
Total Cumulative Bottom 279.07
Total Average Bottom 23.25
Wow. Very interesting numbers. But before you get too excited about the bottom 5, notice the dual 40% declines in June and July. While the top 5 had a more steady growth or decline rate. Could you handle that type of drawdown?
As i said, I am going to be doing this for the last 10 years but it will take some time. I also half way through doing it yearly. Wow. Talk about a rollercoaster ride. On the yearly timeline, the top 5 seemed to have faired MUCH better than the bottom 5. It is also intersting to note on the monthly, that the top gainer from one month never made it onto the top gain list for another month, same goes for the bottom 5. However, some names did flip flop from top to bottom a few times.
This exercisie has definitely shown me how cycles operate even if I cannot see a pattern enough to capitalize on them.
Thanks for listening!
David John Hall
|
|

Registered User
Joined: 4/18/2005
Posts: 4,090
|
David John Hall:
Tell me exactly what you are doing to get your percentages and averages and I'll take a few of the years that you haven't gotten to yet if you like !
I have TC gold, Excel etc etc. It's just important for us to use the EXACT same methods.
the only time I get any real peace for doing this sort of thing now is at night but that should be ok.
|
|
Registered User
Joined: 4/18/2005
Posts: 4,090
|
so to turn this into a strategy you would run those sorts at the end of each month and but the bottom or top five and hold for one month? Any filters on the entry point or volume or basic minimum health?
|
|
Registered User
Joined: 6/6/2005
Posts: 1,157
|
Hey Scott,
Yes, I ran it for October and got 5 Tops and 5 Bottoms. The Bottoms have performed miserably since the end of October. What I would like to find out is if there is a discernable pattern to when the top 5 would perform better or when the bottom 5 would perform better.
To get my numbers and the averages is very simple but time consuming. I pull up the component list of the Russell 1000 so all 1000 stocks are in the watchlist. Then I run a custom date sort on any stock by pressing "C" when my cursur is over the chart. I then pick the month in question...
As an example, let me go through Septembers. To find the top 5 and bottom 5 I load the Russell 1000 into the watchlist.
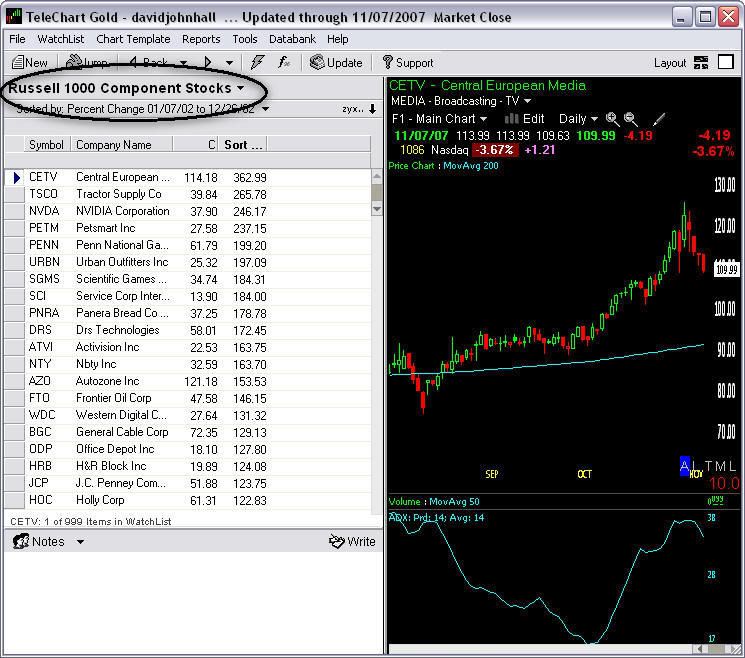
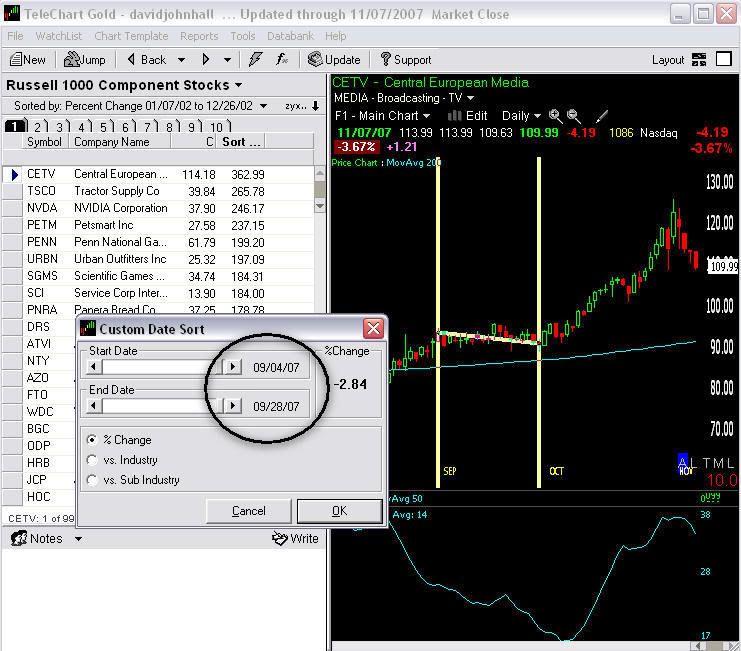
Then I custom date sort the list for September by pressing "c".
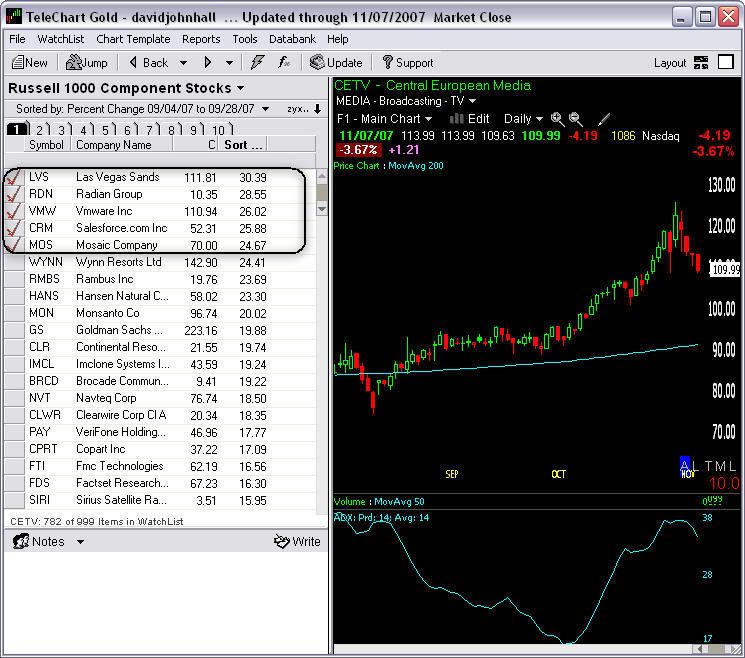
Once I have the list sorted I flagged the top 5...
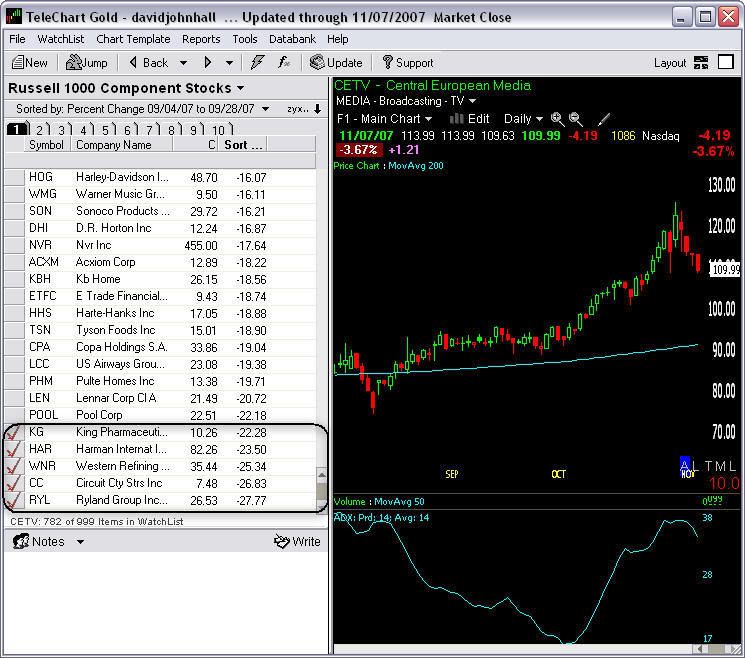
And the bottom 5...
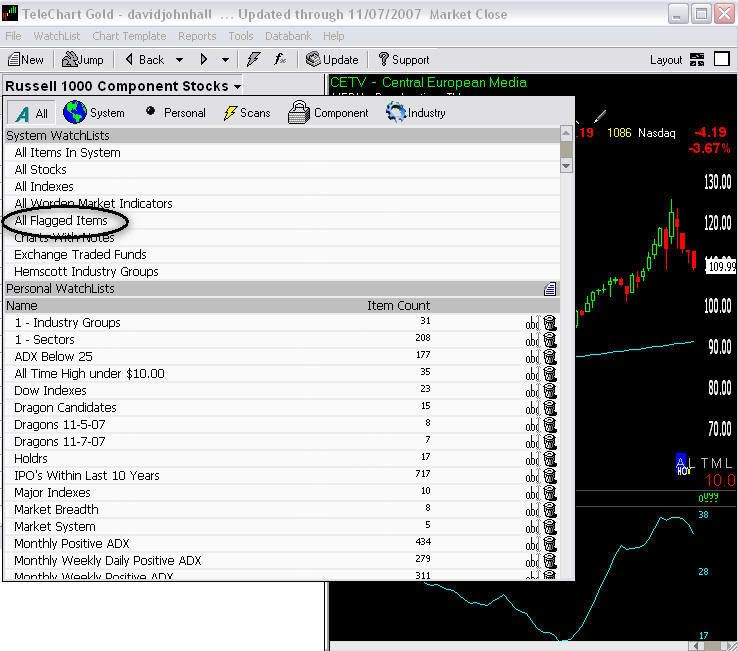
I then open the "All Flagged Items" watchlist...
And my top and bottom 5 show up there...
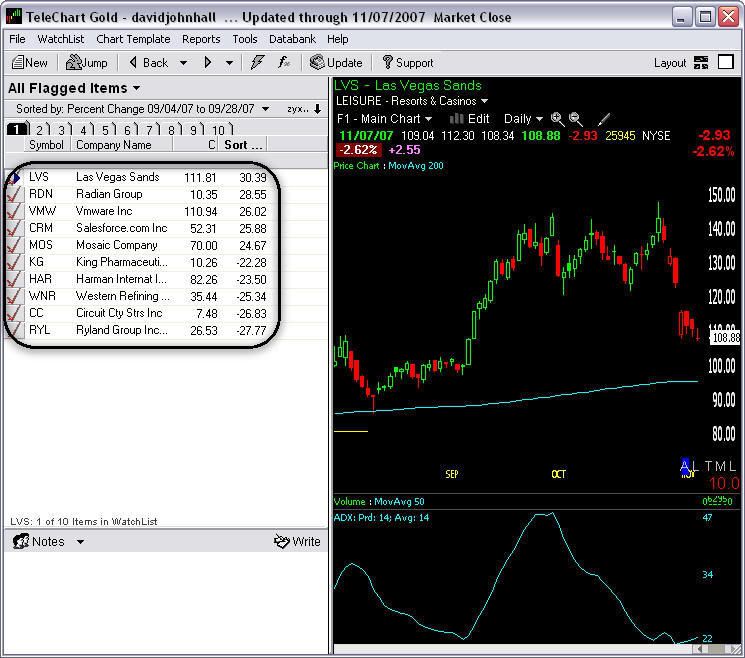
From here I run another custom date sort, but this time going forward one month. For these top 5 and bottom 5 for September, I date sort for October to see how they would have performed.
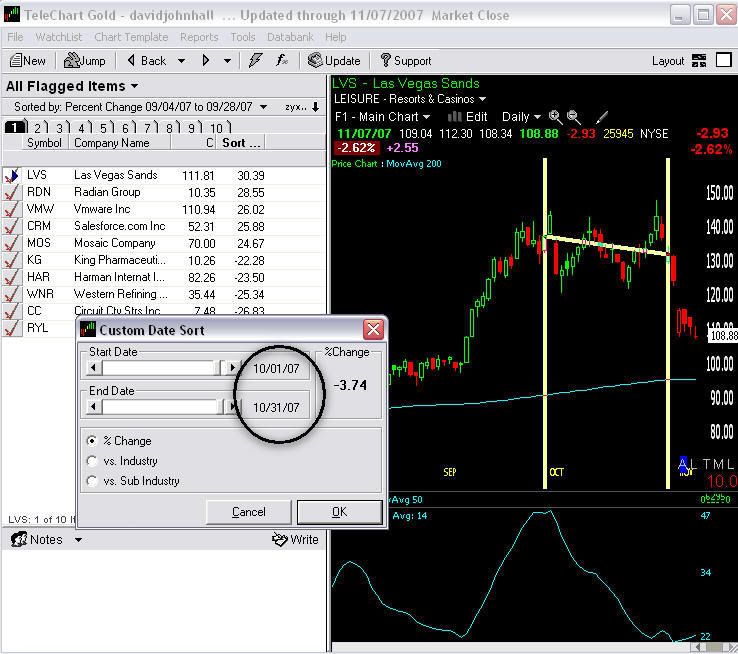
And find out the following information...
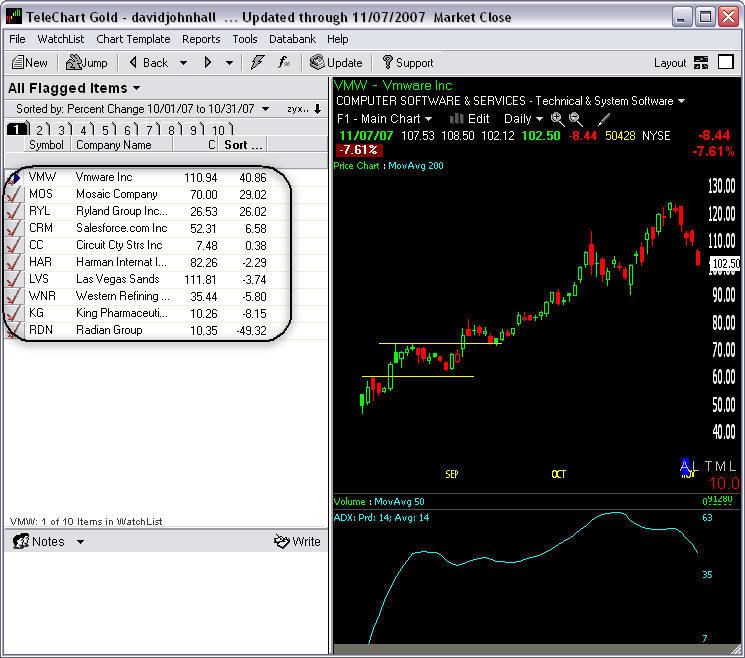
The top 5 for september were
LVS
RDN
VMW
CRM
MOS
The Bottom 5 were...
KG
HAR
WNR
CC
RYL
The way they performed in October was:
TOP
LVS -3.74
RDN -49.32
VMW 40.86
CRM 6.58
MOS 29.02
BOTTOM
KG -8.15
HAR -2.29
WNR -5.80
CC .38
RYL 26.02
I add each set of numbers for the cumulative and then divide by 5 for the average.
TOP
Cumulative 23.4
Average 4.68
Bottom
Cumulative 10.16
Avg 2.03
As you can see -- it's time consuming, but very interesting. I am also thinking these numbers might give us some market sentiment as well.
David John Hall
|
|
Registered User
Joined: 1/28/2005
Posts: 6,049
|
davidjohnhall
I didn't mention it in the post but I also looked at different
groupings of stocks.
I looked at the:
Best 5
Best 10
Worst 5
Worst 10
The group of stocks was the Russell 1000
My sort was the percent change for 6 months.
Stocks were held for 3 months. then the process
was repeated.
The returns were evenly distributed between the stocks.
Each 5 group was 20% of risk and each 10 group was 10%
of the risk.
----------------------------------------------------------------------------------------
I only have 10 quarters of data (30 months).
(of course its open to debate if 6 months as a sort and
3 months as a hold is the best criteria. I was just initially
interested in the results)
I found that in general the bottom group performed worse
(although it did beat the SP500)
-------------------------------------------------------------------------------------
The problems happened recently. the bottom group had heavy
drawdown's.
It is now close to the return of the SP-500
-----------------------------------------------------------------------------------
This is just a guess with limited information but I think the "bottom"
strategy buys value in good times. However at some point you will be
buying the housing market (now) or the Tech sector (in 2000)
As you stated if there is no drawdown protection this can go wrong
on you in a hurry.
---------------------------------------------------------------------------------------
I have been having internet access problems so I cant post all the numbers
now.
I hope to take a more in-depth look at the actual risks in both good times and bad.
Looking at things like portfolio drawdown and so on.
----------------------------------------------------------------------------------------
My guess is if you use TA and have risk control and stops in place. This
can be an effective strategy to scan for candidates.
(with both weak and strong)
------------------------------------------------------------------------------------------
By the way I also performed the tests on ETF's and the small cap
SP600.
The ETF's performed like the Russell 1000. (strong tended to be better than weak)
However the SP600 had really bad results and didn't seem to bring anything to the table.
From this I believe there is some type of sector rotation/quality issue between the
Russell and the SP-600.
Thanks
diceman
|
|
Registered User
Joined: 4/18/2005
Posts: 4,090
|
"The top 5 for september were
LVS
RDN
VMW
CRM
MOS"
I'm a bit confused... I get the same screen as you did but under the custom date sort for october the percentages are different.. The top five RYL and RDN are switched... is this a typo or am I missing something.
I get in order: (ticker - Custom sort value)
VMW - 40.86
MOS - 29.02
RYL - 26.02
CRM - 6.58
CC - .03
Har - 2.29
LVS - 374
WNR -5.80
KG - 8.15
RDN -49.32
What am I missing?
|
|

Registered User
Joined: 10/7/2004
Posts: 319
|
Instead of using the top 5 / bottom 5 for the past month and then holding those stocks for 1 month to track their change, I have been meaning to follow diceman's original post where he was suggesting taking the 5 - 10 best and 5 - 10 worst over a 6 mo period, and holding those stocks for 3 months etc. I was considering doing a modified test of this by using a 6 month history and holding the best / worst stocks for 1 mo vs 3 mo to see what the results might be. But time has been a premium recently and I just haven't gotten around to doing that yet.
When I do, I'll post the results.
survivor
PS the premise I would use is slightly different from David's, instead of holding / tracking a stock from say 10/1 - 10/31, I would track it 9/30 to 10/31. This captures the full gain / loss for the entire month including the 1st day of the month.
|
|
Registered User
Joined: 6/6/2005
Posts: 1,157
|
Hi Scott, I don't think you're missing anything. Those are the right numbers for october. But remember, I'm testing the returns going forward for the top and bottom 5 stocks for September. So once I have septembers top and bottom 5, I am then custom date sorting them for october. I leave them in their september place in the top and bottom because I want to see how they performed relative to where they were.
RDN and RYL are switched because there performance for septemeber and then their performance for october were litterally the opposite. In September RDN gained 28.55% and then lost 49% in October. Does that make sense? But it's left in the top 5 for the second set of numbers because it was in the top 5 for september and that's the month I was testing. Now I can see that a top performing stock in September became a bottom performing stock in October.
David John hall
|
|
Registered User
Joined: 4/18/2005
Posts: 4,090
|
I got it going.. I think but my post was dropped. here we go again.
| AUG |
Sort value |
Sept srt val. |
cum. |
AVG |
| VMW |
40.86 |
26.02 |
|
|
| WYNN |
27.68 |
24.41 |
|
|
| CKFR |
25.52 |
0.52 |
|
|
| GME |
25.04 |
10.21 |
|
|
| HTV |
23.89 |
1.6 |
1.6 |
0.32 |
| GYI |
-30.34 |
-11.76 |
|
|
| THC |
-33.79 |
0.3 |
|
|
| CWTR |
-35.84 |
-14.89 |
|
|
| RDN |
-35.88 |
28.55 |
|
|
| TMA |
-52.25 |
5.24 |
7.44 |
1.488 |
| JULY |
Aug. srt Val |
cum. |
AVG |
| ISRG |
4.59 |
|
|
|
| CROX |
0.79 |
|
|
|
| DADE |
1.29 |
|
|
|
| VMW |
26.02 |
|
|
|
| NVT |
-0.46 |
32.23 |
6.446 |
|
| HMA |
-6.46 |
|
|
|
| AKAM |
-4.28 |
|
|
|
| SEPR |
2.28 |
|
|
|
| MTG |
-13.23 |
|
|
|
| RDN |
-35.88 |
-57.57 |
-11.514 |
|
| JUNE |
July srt val. |
Cum. |
AVG |
| FSLR |
20.07 |
|
|
| VMW |
26.02 |
|
|
| GM |
-14.78 |
|
|
| CLWR |
15.65 |
|
|
| APOL |
1.74 |
48.7 |
9.74 |
| LAZ |
-18.35 |
|
|
| NTY |
1.75 |
|
|
| KIM |
-5.16 |
|
|
| PNRA |
-11.69 |
|
|
| LEN |
-13.97 |
-47.42 |
-9.484 |
That what you are looking for?
|
|
Registered User
Joined: 4/18/2005
Posts: 4,090
|
Let me know where I should start.. Also I'd be curious to run some tests to find out if there is credence to the statemet that various days of the month (trading days) are generaly up at a higher ratio than others. But that's anothe topic,
|
|
Registered User
Joined: 6/6/2005
Posts: 1,157
|
hey Scott - those look right but I'll have to check the numbers when I get home. Williams talks a lot about day of the month trading - but I think his research is directed to commodity markets.
|
|
Registered User
Joined: 4/18/2005
Posts: 4,090
|
I'd think the concept would be valid.. maybee not the same days... I know that there is the options expiration play may carryover.. he mentioned that in his lecture through INVOTV. I know that Martha Stokes adheres to the two weeks at the begining and end of the month as generaly the best to trade.
When I do this day counting thing , if I arrange the cells right then I can plot charts of the probabilities by day sum and by day of the month averaged.
So what sections do you want me to start with? Also if you copy and paste from Excel then you can include the tickers.
|
|
Registered User
Joined: 6/6/2005
Posts: 1,157
|
That's great. I'm going to go back 10 years because I want an overwhelming amount of evidence. Looking at the returns from either side for 2006, it appears as if a beinning of the month strategy might work out well when accompanied with other simple technical indicators.
It would also be interesting to note where the top gainers of the month came from. But that's another test for another time.
And your graphs sound very interesting and i would love to see them. So the open years that need data are
2005
2004
2003
2001
2000
1999
1998
1997
I will enter 2006 into excell and post them here.
Diceman,
Good to see you're back! This is a great line of research you've introduced. I think a 6 month study is as good as any as well. Looking at how the bottom group faired over longer periods it's easy to believe the top group outperformed. This might be a very valid way to quantify which strategy might work better with which time frame.
I'm also looking at the charts of the general index to see which group performs better during which months.
If the monthly strategy works that would mean purchasing 5 stocks (top or bottom given the fact that we figure out which has better odds of success), and letting them ride for 20 days. I also agree that the sub prime debacale has created a mess out of the bottom 5 the last couple months. I am sure there must be a way to see that coming. Perhaps not.
Looking forward to deeper review.
David John Hall
|
|
Registered User
Joined: 11/7/2007
Posts: 49
|
If you believe in your system, which i personally do not find very interesting - or special lets say.
Should you could ride the whole thing without a worry by using LEAPS. They are cheaper than options, and you sleep like a baby while your 40% fluctuations take place.
Just remember - TIME IS MONEY.
|
|
Registered User
Joined: 6/6/2005
Posts: 1,157
|
Alexandria,
I thank you for you for your deep and constructive analysis of my line of thought (hardly a system). In case you didn’t see it, the title of the the post is SOME INTERESTING NUMBERS, not WORLD’S GREATEST TRADING SYSTEM or UNDISCOVERED MONEY MACHINE UNCOVERED or STOCK MARKET ATM MACHINE.
In light of this, could you please post any special qualifications that you may have so I can determine what your disinterest in my (system?) may mean? Such as 1) You’ve qualified all market activity and found that focusing on strength or weakness to be a waste of time. 2) You believe that historical price action is insignificant and not worth examining. 3) You like throwing out random comments without backing them up?
I am a system trader (not the world’s greatest or most interesting but profitable) who is currently sharing a line of thought with other interested parties. Your lack of interest would be very interesting to me were you able to 1) Quantify your statement with reasons behind why or why you don’t find it interesting. 2) The type of trader that you are so that I may come to my own conclusions.
Thanks again.
David John Hall
P.S. All that said, I still thank you for sharing your ideas about LEAPS. And enjoyed thinking through your argument about interest. As in, does a trading system need to be interesting? Can it still be boring and generate a profit? Should I be looking for an interesting one?
|
|
Registered User
Joined: 4/18/2005
Posts: 4,090
|
"I am sure there must be a way to see that coming. Perhaps not"---Martha Stokes called it in 2005.
I have read that the boring aproaches tend to be quite proffitable. some of the best investments are "boring companies". CLHB ?
so you've done 2007 to this point? you]re on 06' i'll start 05
|
|
Registered User
Joined: 4/18/2005
Posts: 4,090
|
how to account for new listings,ipos and dropped stocks?
|
|
Registered User
Joined: 6/6/2005
Posts: 1,157
|
That is a good point. To be included in the month I was only including stocks trading in the month. I am not sure how to account for dropped listings and will have to settle for some margin of discrepancy, unless it can be decided how to include them.
I was not going to do 2007 until the end of 2007, but seeing as we are going by month it wouldn't hurt.
I will do 2004 today or tomorrow.
David John Hall
|
|
Registered User
Joined: 11/7/2007
Posts: 49
|
David I didn't mean "not interesting" in that sense. Sorry for the confusion, and you are correct "exciting" doesn't mean profitable. I have seen already lots of folks around here painting lots of colors in the charts with probably little purpose.
The reason why I said "not interesting" is simple. Take any equity in a 1 yr period and most likely than not - you will find in that time frame a big fluctuation. The problem is not finding that (hence you proved how easy that is - the problem is timing, and position.
Will you be long when you need to be long? will you be short when you need to be short? Even if you back your trade with the LEAP you still need to decide when to jump in and out to be profitable.
I have traded suscessfully for over 10yrs, and never had any need for so many scans, research, or pretty charts. I have nothing against it either, just think a lot of folks may be wasting their time, when we know how important time is.
Best trades usually carry insider information, as everything in the world - your acquaintances are most important - just the difference between getting there or not. The rest is probability without certainty, with the exception of a few systems I have seem, which have proved to put probability and certainty on your side - but not by much.
|
|


Worden Trainer
Joined: 10/1/2004
Posts: 18,819
|
QUOTEwith the exception of a few systems I have seem, which have proved to put probability and certainty on your side
Be very careful. Realitycheck is not the only person to know your previous login names.
- Craig
Here to Help!
|
|
Registered User
Joined: 4/18/2005
Posts: 4,090
|
I Knew it ! ! Ha ha ha
|
|
Registered User
Joined: 6/6/2005
Posts: 1,157
|
Thanks Alexandria,
I agree that every profesional chart I have seen -- meaning, used and shown by professionals, are very clean charts. That is because, in their experience (my belief) (system tested or personal or insider info oriented) they trade price levels and movement and confirmations of each. That's why i removed all indicators but volume and channels (price levels) from my charts. But different traders have different styles, and reading The Market Wizard interviews with the pros I understand that some of them spend thousands of dollars creating market inefficiancy models and closely guarded algorhythems. My delving into this exercise is to locate if any type of rotation occurs at the top or the bottom of the list month in and month out. I have fallen into the belief that "the smart money" is not just one man with a lot of money messing with us all, but a group that all plays the same way, moving in and out and rotating as needed. I agree completely on the need for a timing model. I am not a floor trader, do not know any, so I'll have to follow the work of what has come before me and follow my own line of creative thinking. Sometimes a discarded idea is more important than an adopted one. And I don't think this one is ready for the junk heap quite yet. If and when it goes, it will join thousands of others, believe me. But there are also one or two that didn't make the junk heap. And those are worth the effort of the rest.
Thanks for the deeper input. I appreciate it tremendously.
David John Hall
|
|
Registered User
Joined: 11/7/2007
Posts: 49
|
Hello Craig, it is difficult to post as an impostor. And I am not much of a lier - in fact you well know I say things as I think or believe in them. Not that they are always pretty, but they are true.
You gave me not other options here, and as you well know I dissagree with you on your decision to ban me.
The reason for once is that I never directly posted any information regarding my system at least I was being asked. And second take all my post here over the yrs what about 2000 or 3000 something like that and see how many times I refer to "the system". If seems that unless you were under superior pressure that my banning was more personal than anything else.
In any case, I know that as well as you many others probably new by my second post that Alexandria wasn't really Alexandria- Hence they read my posts to the point they know my form of expresion. I also know that you can track my IP -and I could mask that too, but decided not too do so.
I am who I am - Bigblock. Now the question is are you going to continue to make me be Alexandria, lBigblock, lllBigblock, or whatever else. or are you going to grant me the priveledge to post here as who I am - Bigblock.
Let me know.
|
|
Registered User
Joined: 4/18/2005
Posts: 4,090
|
"My delving into this exercise is to locate if any type of rotation occurs at the top or the bottom of the list month in and month out. " -----Something I started playing with several months ago was to quarterly or yearly check all the hemscots that were crossing up through their 110 bar movinn averages on a weely view (as I recal). Then take the top 5-10 sectors open them and take the top 5 or those stocks that were or had recently crossed up through their 100 bar moving averages on a daily (so I guess weekly view would have been 25 bar average). Often something resembling an identifiably bottom will be forming.
My thinking was that sectors do cycle..and some feed on others weakness and others get a boost fromthe sucess of others that were slightly before them. So this could be a way of finding the sectors that are setting up for a reversal. I spent more time looking at the new bottoming sectors. With in those sectors there are alwayse some that are complete duds and some tha out perform.. so the question I had was which is better... the individual stocks that are crossing up through their moving averages? or those that are already performing well? My suspicion would be the latter.
Alexandria:
"Hence they read my posts to the point they know my form of expresion"---- but what does that say? Well ... welcome back.  (no sarcasam).... but can I still call you Alexandria? (no sarcasam).... but can I still call you Alexandria?
|
|
Registered User
Joined: 4/18/2005
Posts: 4,090
|
Sorry that should be 100 bar moving average.
|
|
Worden Trainer
Joined: 10/1/2004
Posts: 18,819
|
It is very simple, Alexandria: you don't mention your system.
Nobody will ask you about it because you won't mention it.
If someone does ask, you will not acknowledge the question.
Very simple and zero wiggle room or tolerance. I hope you can help yourself and stick to the simple rule.
Let's see if Alexandria can do it and be a contributer to the discussions.
To clear up things you brought up in another post (for you and anyone who wonders)...
QUOTE (Alexandria) It seems to me that this is a dictatorship board and that if you don't talk or promote the wordens produts you are given the cold side.
These boards are a dictatorship. They are owned and run by Worden. At no point were they presented as a democracy.
QUOTE So there is no real freedom expression here
You are correct; content is monitored and controled by the owner of these boards. If you appear to be using these boards for any reason Worden does not like, you will be stricken along with your content.
Most have no trouble enjoying this rich community. A community like this is so rare on the Internet (at no cost, especially). A BIG reason why these boards are so rich is because of how they are run and the tight controls on content that we deem nefarious, pumped or commercial.
There are thousands of discussion boards on the net for talking stocks and markets. You keep coming back when you could of easily moved to another of the boards. Trust us to keep these boards a place to come back to. The best thing about these boards is you don't have to read them. The best thing about this community is you don't have to be a member.
- Craig
Here to Help!
|
|
Registered User
Joined: 12/7/2004
Posts: 393
|
Alexandria, out of curiosity is this name from the city in Egypt or its founder ? Glad you made it back.
|
|
Registered User
Joined: 11/7/2007
Posts: 49
|
Fair enough Craig. I would like to ask if you can unlock, or allow my original name - "Bigblock".
Also am I allowed to post my indicators? and will I be allowed to post with charting applications which are not Worden's? No reference to any system in particular, no explanations as far as the system goes (read it as is), no reference to anything having to do with my business.
I assume folks here are allowed to post custom indicators which can be called as they wish. I will call mine Alexandria for whatever it may matters.
And yes laphill - Alexandria the city of egypt founded by Alexander the Great in 323 BC.
|
|
Worden Trainer
Joined: 10/1/2004
Posts: 18,819
|
The BigBlock name's suspension is sceduled to lift in 10 days (Nov 19th at 7:30am).
If your indicators are available in software that is not sold by you, yes. If not, for the sake of simplicity, no.
Lets see how things go. If you have any questions, you are welcome to email me via support@worden.com.
- Craig
Here to Help!
|
|

Registered User
Joined: 3/21/2006
Posts: 4,308
|
I agree with Craig, what is your obsession with this forum??? With countless other discussion platforms avalable why are we so lucky that we have to suffer your denigrating and warped point of veiw, that none but a few here can appreciate.
"this is not a democracy" I wish that it were, then we could all vote on the issue of your continued haunting of this great forum. You contribute nothing but controversy and disharmony. "all those pretty colored charts are meaningless" If so bigblock or bigblob or what ever covert name you choose to hide under, then how are some of us serious traders making profits from our colorful technical analysis. You always say that we are wasting our time and yet you offer no alternative avenues for wich to explore.
(IMO) if you are allowed to return to this forum, then you will only degrade the integrity of its contents. Does not your Website have a discussion forum? If so then why not lurk among its contents and leave this forum to those that want a free exchange of technical wisdome inclutered by the likes of you...
I am done for now, and Craig why not let the members of this forum decide if we want him to return..
Apsll..
|
|
Registered User
Joined: 3/21/2006
Posts: 4,308
|
Actually one more point I would like to make. Being the author of your own securities and options trading website. (hopefully successfull) then your behavior here is quite strange, and one has to wonder if maybe you should be donning a jump-suit and under a doctors care. Your unhealthy obsession with feeling the need to infiltrate this forum under asumed names is suspect, and speaks to some maybee psychotic undertones.
(IMO)
Apsll.
|
|
Registered User
Joined: 6/6/2005
Posts: 1,157
|
Hey Everyone,
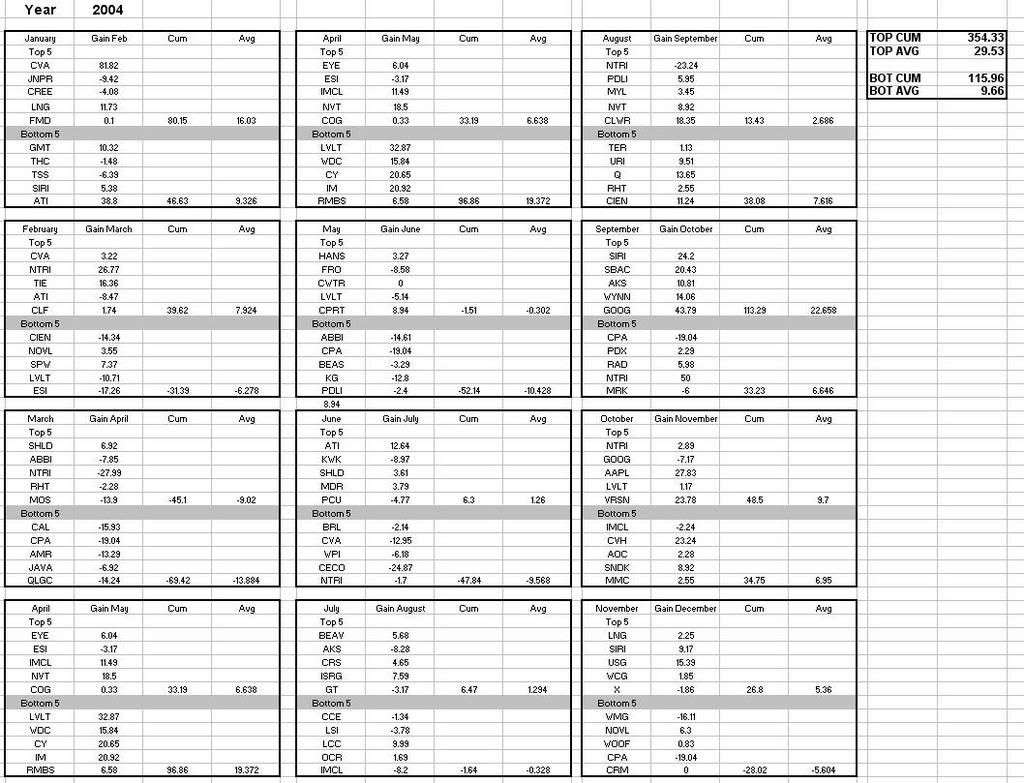
Here are the numbers for 2004. This performance is derived from buying the top 5 and bottom 5 stocks in the Russell 1000 at the end of the month and holding them over until the end of the next month.
Here is the Rus in 2004.
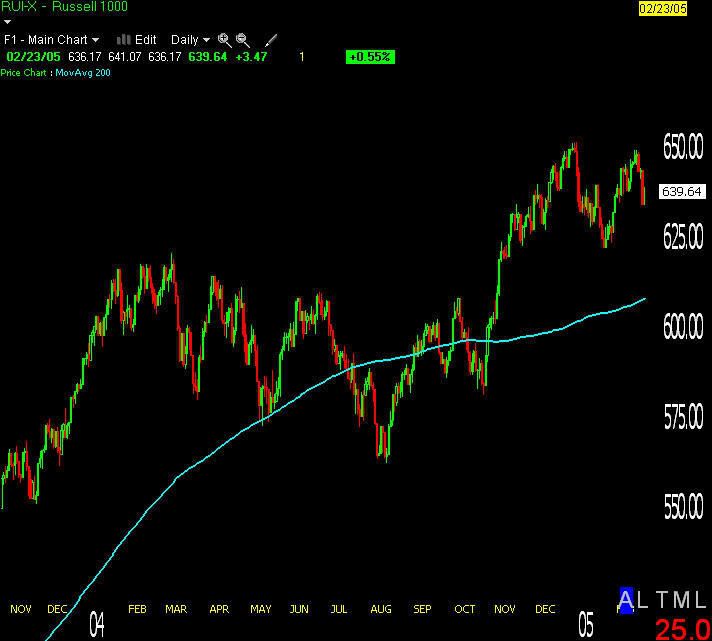
Here's how it did...
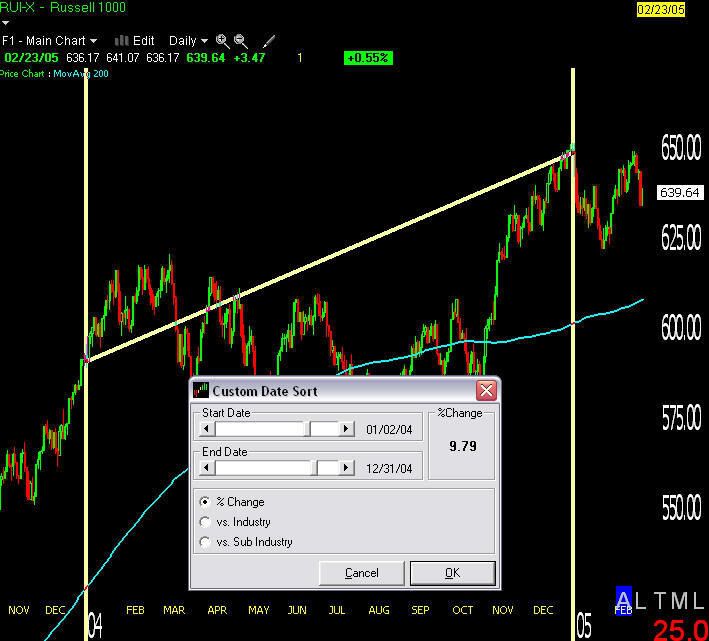
And here are the numbers from buing the top and bottom 5. Buying the top 5 at the end of the month performed much better for this year, but as you can see, both did very well in the long run. I am going to look into what "Alexandria" suggested and see if a strategy using options can be used as a hedge against drawdowns.
More to come.
Thanks for listening!
David John Hall
|
|
Registered User
Joined: 4/18/2005
Posts: 4,090
|
Wow I look like a slacker now.
|
|
Registered User
Joined: 6/6/2005
Posts: 1,157
|
LOL Scott,Not at all. I'm on a roll. These numbers are still very interesting to me - I'll be doing 2003 tonight. Your idea of an excell spreadsheet has helped me tremendously. Can't wait to see some of the numbers for the bear and preceding boom!
|
|
Registered User
Joined: 6/6/2005
Posts: 1,157
|
My apologies everyone,
Looks like I included April two times on the above spreadsheet. I will correct this tonight by cutting it out and including the results for December 2004. This will change the numbers. Not much for the top 5 but quite a bit for the bottom 5 I believe.
David John Hall
|
|
Registered User
Joined: 11/7/2007
Posts: 49
|
Aspll if I wanted I could give you all technical analysis you want or need. It is not the solution. I think my perspective opens the eyes to those who listen to me, and help them approach trades in different ways (not only technical).
I can tell you have probably have a lot of pshycotherarpy - me on the other hand had none. I like to take it out on the open - anytime / anywhere. The same way I approach the markets.
I have no obsesion with this board - I like this board for reasons that those who need to know already know what those reasons are.
Certainly I exposed my disagreement with management here (directly in the open, and right here on the board), when my banning occur. Those posts of course were also deleted by management.
As far as i know except for the conflict of interest created by the fact that I also provide services on the same category as the worden, I have never insulted or clutter those boards with senseless information. Everyone is entlitle to his/her perspective - reality is harsh sometimes. I always present it as I see it - whether you like it or not is not my problem. It is yours. A quick solution is to avoid reading my post, oher than that I am not sure what to tell you, except that I have been around much longer thatn you, and will probably still be around once you are gone. I have seem plenty coming and going. Markets are tough, arent they?
good luck.
|
|
Registered User
Joined: 3/21/2006
Posts: 4,308
|
Believe me, I am in no need of your advice on any level. I do not know why you keep going back to this. Lets get it straight right now, I view you as a very unstable person. I would not let you manage my nephews portfolio. I have never sought you out for any advice nor will I ever. Diceman has exposed you countless times for the type of individual that you are.
Next, do the worden brothers frequent your website? Are they banned from visiting the message boards that you run over there? I did not think so .. You act as if you are a welcome fixture here, when the reality is that save a few individuals you are a pain in everyones ###.
As far as reading your post go, the only threads that you have been a part of have been deleted because you are unable to control yourself. You will probably force the Wordens into geting rid of this thread as well. If I were in a room with 10 people and only one of them would talk to me and the other 9 wanted nothing to do with me, then I would leave the room.
No one cares about your problems with the Wordens, everyone has made it clear that they are not interested in any product that you sponser. We just want to be able to discuss our colorfull charts free from denigrating coments and your obnoxious comentary.
|
|
Registered User
Joined: 11/7/2007
Posts: 49
|
Don't have lot of time here. Aspll you can find my reply to you here
http://www.worden.com/training/default.aspx?g=posts&t=25623
Have a great weekend
|
|
Registered User
Joined: 11/11/2006
Posts: 359
|
davidjohnhall:
Forgive me, but are the numbers presented in your spreadsheet for each month the % of gain/loss on the GAIN,CUM and AVE columns?
Keep the good work going!
Mammon
|
|
Registered User
Joined: 6/6/2005
Posts: 1,157
|
Hey Mammon,
The first column are the top 5 and bottom 5 gaining stocks (percentage wise) for the month listed above them. The next colum is how the performed the following month. The cum column (empty save for the single number) is the cumulative total of the top five and the number all alone under the grey bar is the cumulative total of the bottom five. The next colum is the average trade gain or loss for the top 5 and then the bottom five. To the very far right you have the numbers for all of the top months added together and then averaged, and then all of the bottom 5 months, added together and then averaged.
i am working on 2003 right now and these numbers are quite extraordinary. It's important for me not to place any value on the individual years, and wait until i can review them in relation to each other after I have the 10 year group together. When I am done I am also going to group the months together to discern if certain months are more profitable than others. I can't wait to see how that turns out, and I believe I have my next month of research planned out for me!
David John Hall
|
|
|
Guest-1 |