Registered User
Joined: 12/21/2004
Posts: 902
|
AVD came up on my breakout scan tonight - and lookee! - it's another Agricultural Chemical stock. Due to the ethanol boom this year, several stocks in this sector have had an exceptional 2007 so far (TRA, TNH, CH, and KMBG have all made $$ for me this year, and they and MOS and AGU consistently show up on my MACD-H100 scans). Barchart rates this the #1 sector by far in YTD return.
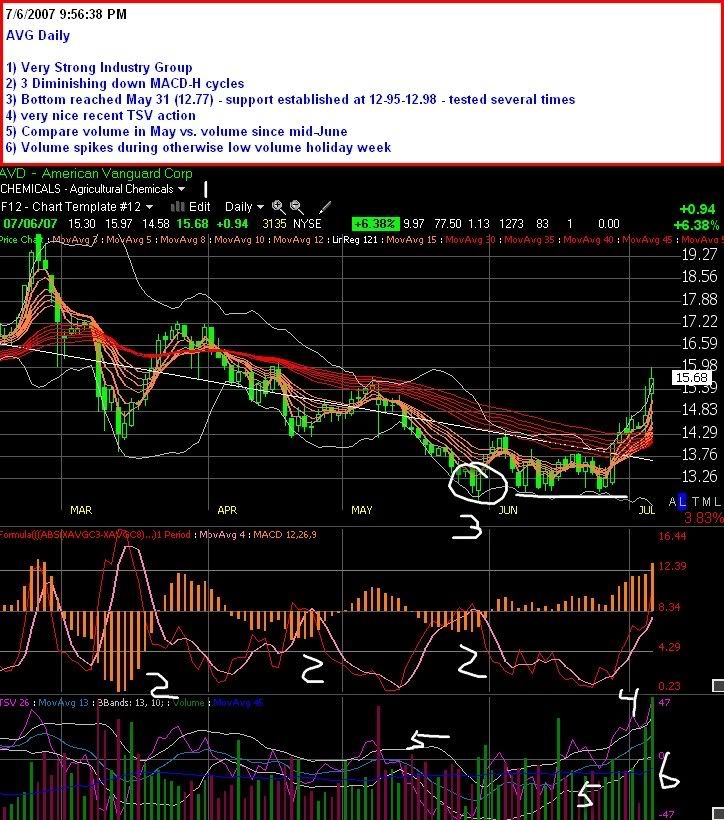
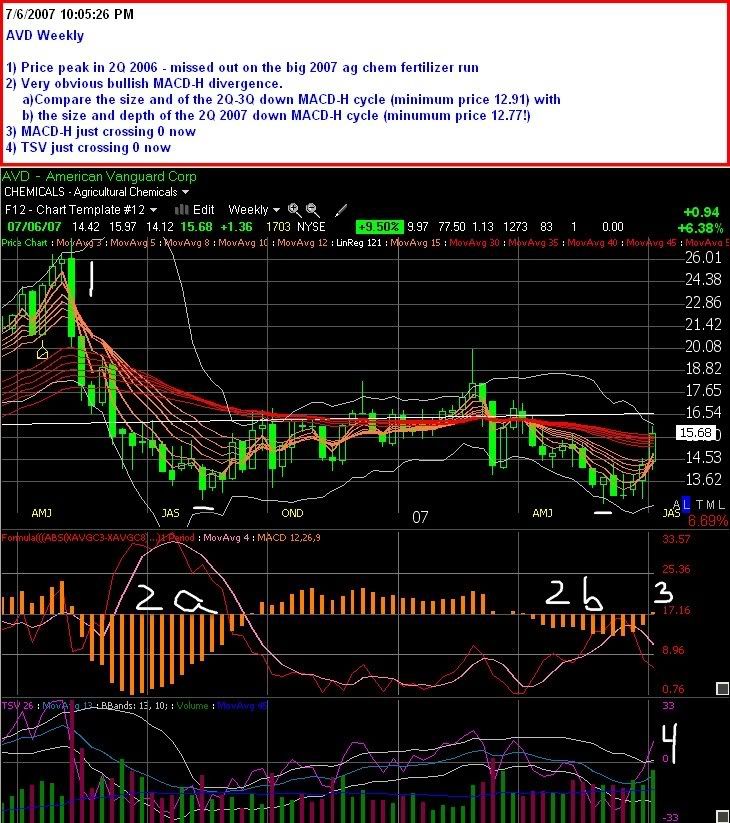
AVD is late to the party, having never recovered from a May ག downturn, and is just coming around now. The things that I look for are good - MACD-H is strong (no Elder dictum yet, price isn't at multi-month highs yet, although MACD-H is), there's a bullish MACD-H divergence on the weekly chart (yes!) volume is picking up (breakout volume), and TSV is strong on the daily, and just coming above 0 on the weekly.
JC has created a monster by getting me to post charts. I'm including a daily (zoom=5), so you can see the recent MACD-H history, and weekly (zoom=6) so you can see the MACD-H divergence.
Even if AVD doesn't tickle your fancy, definitely check out the other ag chem stocks - it's a sector that is definitely en fuego 
And of course on the daily chart I meant "AVD" not "AVG" LOL
|
|

Registered User
Joined: 4/18/2005
Posts: 4,090
|
you know I noticed that ! I think the service I use had a discussion about them in general recently..... I'm so focused on the "simple aproach" system that I let what wants to move come to me and I gotta say it's working pretty well. I've been seeing allot of regional banks pop up.. but this may be an intermediate bounce that is due to the whole sector.
Infact I recently traded an Ag chem. I closed my spreadsheet and I can't think who it was!
Excellent charting and analysis by the way... nice post.
|
|

Registered User
Joined: 3/21/2006
Posts: 4,308
|
Hohandy, I am just taking this opportunity to test the new editing program that you turned me onto, and to run a MACD-H retest candidate by you, if you have not already picked up on it..
What do think about MCCC -

|
|
Registered User
Joined: 12/21/2004
Posts: 902
|
Nice job Tommy - chart looks good. On MCCC I especially like the weekly zoomed out (doing a very nice cup pattern) and the monthly MACD-H (MACD-H=100). Nice Tobydad profile too on the daily.
I didn't pick this one up - technically the day of the price high, the MACD-H was lower than the April high - the next day, the MACD-H high, the price was lower than the day before. But looking at it, and the MACD-H strength and volume idicators, I would be very surprised if this doesn't retest. Nice to know that the Elder dictum doesn't have to be totally exact LOL - we'll have to experiment with that.
Do you use a Diceman indicator for entry or are you using the MACD-H crossing 0? My Diceman would have indicated the decision point Friday the 29th.
|
|
Registered User
Joined: 3/21/2006
Posts: 4,308
|
I just sorted one of my watch lists by a linear regression line for possitive slope and also the indicator in the bottom window to show me when MACD-H crosses the zero line. Came up with a list of about 35 stocks. just scaned by eye and came up with a couple that looked good. I also like NXST but the BOP was red so I left it out.. You are right about MCCC not being a true (Elder) candidate..
|
|
Registered User
Joined: 9/21/2005
Posts: 566
|
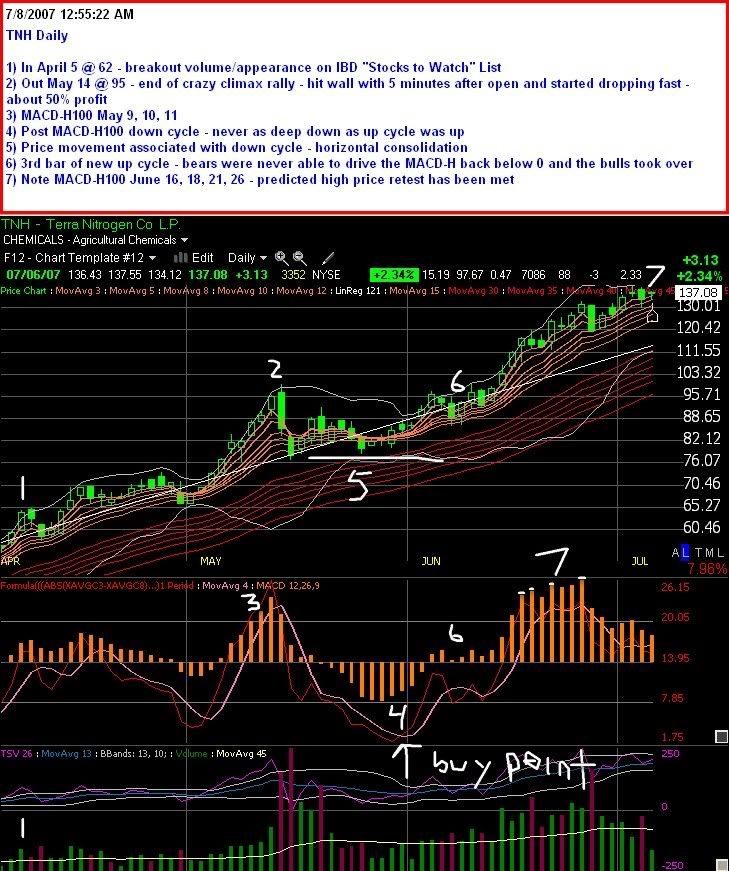
HH, I looked at TNH in late May and early June and seems like MACDH had a fairly low reading prior to the stock's next move up. I would think you would have avoided the stock or scaled back based on this bearish sentiment. Am I misreading how you use the indicator or was this just an anomolous situation?
It looks like TSV and Diceman's 12-26 indicator moved up well in conjunction with price, but MS took a plunge, so some mixed signals.
|
|
Registered User
Joined: 12/21/2004
Posts: 902
|
JC - look at the MACD-H down cycle in mid-May that corresponded to the collapse of the Apr-May crazy climax rally. That down cycle never got as deep as the previous up cycle which included the MACD-H100 was high. I think we talked about this a bit a couple weeks ago - if the down cycle goes lower than the up cycle was high, then abandon it. But it didn't happen in this case - the Diceman indicator flashed a buy signal at the decision point on May 31, and there would have been a very nice return.
I was in (and did quite well) in Apr and May. When the Diceman flashed again, I had CF in my porfolio and didn't want to have 2 fertilizer stocks at the same time, so I took a pass. Wish I hadn't LOL
|
|
Registered User
Joined: 9/21/2005
Posts: 566
|
ok that makes sense. So for purposes of MACDH analysis, you compare the depth of the down with the height of the immediate prior up. If the MACDH immediately prior had a greater range up (than current down), this would keep a bullish sentiment on the stock.
Then you would look for a cross on the Diceman as your trigger point on the HNC. By the way, what ma settings do you use for your Diceman?
Would you clarify point 6 a bit more, not sure I am seeing why that is so significant to you.
Lastly, did you exit a position at point 2 in your diagram? If so, what was your method of exit/profit taking?
By the way, pasting in a chart is great. This adds exponentially to understanding your commentary.
|
|
Registered User
Joined: 9/21/2005
Posts: 566
|
Oh also, have you screened for stocks like JSDA using the MACDH as part of your investment selection or mostly focus on the IBD/Bar stocks and momentum plays?
|
|
Registered User
Joined: 4/18/2005
Posts: 4,090
|
Hohandy
what is the red line? the diceman indicator? I haven't followed it in a while (well my version of it I use for sorting) The 4 bar moving average is a new one for me ... I asume that is the trigger line?
|
|
Registered User
Joined: 12/21/2004
Posts: 902
|
The red line is the Diceman - the pink line is the 4ma. When I'm using the HNC/Diceman/MACDH100 setup, I use the Diceman crossing it's 4ma as my trigger (would have worked well with TNH, no?)
JC - in answer to your questions - think of the MACD-H in terms of the narrative of the bulls and the bears and look at the extreme (and secondarily, the length) of every cycle. An up cycle who's high point is higher from 0 than the last down cycle's low means that comparitively the bulls are more powerful than the bears. Compare the latest cycles of each with the ones that came before - do they tell a story? - look back up at the AVD daily chart - see how the 3 successive declining strength down cycles tells a story about the declining strength of the bears?
That's my point about Point 6 in the TNH chart. After the bulls finally came back in after the down cycle, they didn't really establish control those first couple of bars - the MACD-H didn't rise all that high off of 0 (compare this with the strength of the first couple of bars in the current JSDA up cycle). There was price weakness, and the bears could easily have re-asserted themselves at that point. On that third bar, the tried pulling the MACD-H back below 0 and failed. Within a few days the bulls had complete control again. I look at something like that as a subtle, but key, indicator that the bears hadn't reestablished strength relative to the bulls at a key point where they could have nipped the new rally in the bud. Traders could have seen that MACD-H going back down and thought that TNH was done and chose to bail - but they didn't because it didn't go below 0.
Rather than just abstract lines and bars on a screen, always try and put what you're seeing into a story or narrative that tells the on-going tale of the bulls and the bears and which side is currently winning the tug-of-war and how price will react to that. Always remember that around the world, there are thousands of traders seeing the same things that you do and acting on those signals (i.e., things like buying when MACD-H goes over 0, selling when it goes below, buying when a key MA is crossed from below, selling when it is violated from above, buying when Stoch crosses 20 going up, selling when Stoch crosses 80 going down, buying when a key support is retested, selling when resistance is met, etc). In a way, the signals are self-fulfilling prophesies. they tell you what the price should do, and because others see those exact same signals and act on them, that usually is exactly what happens - very cool in that way - I find it strangely comforting.
So let's go back to Point 6 and put it in the narrative: There was this crazy climax run on TNH the first 2 weeks of May (I even had a thread on here about it - talk about fear and greed! LOL). It finally collapsed and the bears came in in force, driving the price down almost 25% in 2 days. Was it just a short-term reaction to the extreme run-up - or was TNH done and from now on the bears would be in control? One clue was the MACD-H=100 at the top - we had reason to believe that the price would come back. Another clue was the low point of the low MACD-H cycle - the strength of the bears when they had the bulls on the run didn't match the strength of the bulls at the top. Then the bearhold weakened, and the MACD-H started rising for 6 straight days, getting above 0 until it got to Point 6. Where would it go from here? Was the 6 day MACD-H uptrend just a temporary "bounce" and the bears would come back in and make May 14 the "top"? Didn't happen - they had the opportunity and couldn't do it. This confirmed the MACD-H100 in May, and the relative sizes of the up vs down MACD-H cycles and their extreme points - and people acted on that. The rest is another 50% gain in price. Make sense?
As for my own position in TNH - the first 2 weeks of May were crazy - huge price movement and crazy increasing volume. Very scary, knowing that at some point the shoe would not only drop, but would plunge - yet wanting to hang on and get the maximum gain from this crazy price rise. So I watched very carefully and re-set my stops almost hourly. The morning of the 14th, the price ran up $3 in 5 minutes and then hit a wall just short of $100 and started plunging - it's first down movement in 2 weeks on very high volume. It dropped quickly to $92, then started a bounce. When it was apparent that the bounce would stall short of the open, and started dropping again, I set a stop and got stopped out at $95. Usually I don't keep such a close eye and micro-manage my positions, but TNH in that rally was a very special case. I didn't go back in on May 31 when the Diceman indicator hit, because by that point I had taken a postion in CF and didn't want to have 2 fertilizer stocks in my portfolio (Mammon would disagree with that decsion, I think)
As for JSDA - you had brought that up in a discussion on the Hohandy thread back on June 26, and it looked very promising. I said I would put it on a watchlist and wait for a breakout, and that is exactly what happened on July 5. But I do screen for breakouts and it would have showed up in my screen that night anyway.
Hope all this makes sense.
|
|
Registered User
Joined: 9/21/2005
Posts: 566
|
Yes, very helpful. As for JSDA, we must use the term breakout in a different sense. For me, I think of breakout as a long period of support resistance - usually sideways - and then stock typically goes up through top of range on heavy volume.
In what respect did JSDA breakout in your view in July. Were you drawing a down sloping channel - or do you have other types of formations you are looking at?
|
|
Registered User
Joined: 12/21/2004
Posts: 902
|
I generally consider "breakout" to be high volume (1.5x45mav), and price closing in the upper portion of the daily high/low spread which finishes outside of the prevailing channel. The window that I look at these is zoom=6 with a 50lr around price.
But the high volume/high close placement in the daily spread is to me the most important component of what I'm looking for in a "breakout".
|
|
Registered User
Joined: 1/28/2005
Posts: 6,049
|
Interesting to note. On the AVD daily chart. Not only were
bear cycles in the MACD-H diminishing. (the 2's)
Before each there was a bull cycle that diminished.
Almost as if MACD-H was predicting a decision point
in the 3 zone.
(I wonder if that's a pattern anyone has looked for
before?)
-------------------------------------------------------------------------------
Also TNH is in the "classic" pattern of the original HNC/Diceman
post. Fast averages above slow. Sloping upward.
With "standard" buy points in early May and late May.
(decision points)
Interesting that in theory traders could be buy the same stock for different reasons.
Also interesting how unrelated indicators agree with their information.
Notice on TNH. Most of the time the diceman indicator is above its
4 bar moving average. TSV is above its upper bollinger band.
(buying pressure)
Notice on the daily AVD at 5. TSV is below its lower band
with diceman above it 4 bar MAV. (selling pressure) at
4 that pattern changes to buying pressure.
Thanks
diceman
|
|
Registered User
Joined: 12/21/2004
Posts: 902
|
Nice value-added commentary, Dice. Thanks. 
|
|
Registered User
Joined: 12/21/2004
Posts: 902
|
Back to AVD - strong day today, very high volume, MACD-H=100. This has all the appearance and feel of making a major move (IMO).
|
|
Registered User
Joined: 9/21/2005
Posts: 566
|
makes me think, you find the hot sector and all you have to do is avoid stepping in front of the charging bulls.
|
|
Registered User
Joined: 12/21/2004
Posts: 902
|
JC - have you thought about applying MACD-H analysis to the Hemscott Industry Groups? - might be interesting to see which industries are at MACD-H=100
|
|
Registered User
Joined: 9/21/2005
Posts: 566
|
I had not thought of doing it. Interesting idea - you have a lot of them! Remind me, when you reference applying MACDH=100, essentially you would sort the group by clicking on the MACDH indicator and looking for highest current value (100). I know you have spoken about this before but its easier to ask then go searching for it (even though Diceman would not approve of my laziness)
|
|
Registered User
Joined: 12/21/2004
Posts: 902
|
JC - yes you have it. The MACD-H=100 is good for finding candidates if you're using the HNC/Diceman setup and entering at the decision point, but just in general, you should be able to evaluate trend strength by looking at the MACD-H cycles - see which ones are supporting a upward price trend with high MACD-H values, which ones are indicating approaching bottoms such as we saw in the AVD and JSDA charts, etc. There's no reason why you can't apply these to the industry charts as well as the individual stock charts. Once you find an industry that has a good setup, look inside that industry at the individual stocks that have the closest match, pattern-wise to the industry and go with those.
I've been meaning to do a post on the value (and fun) of using the Visual Sort as a tool. You know that price and indicator window axes (plural of axis, *not* hatchets LOL) expand to show the largest value within the time frame of each zoom window and then the Visual Sort gives a 0-100 value depending on how far up the axis the particular price bar or indicator that you're sorting by is. So take the components of an index, or a watchlist, put it on monthly or weekly and zoom it out to show 10-15 years worth of data and do a visual sort on price or volume or MACD-H or OBV or TSV or any other non-oscillating bar or indicator (don't use something range bound by 0 and 100 such as stochastics) - and you can easily find, for example, stocks with current alltime price highs or volume highs or OBV highs or anything else that you think indicates strength by sorting and seeing which stocks have a Visual Sort Value = 100.
The Visual Sort really is quite an interesting tool - play around with it using different bars and indicators, different chart time frames and different zoom levels. One idea is to maybe do a daily sort to find stocks within maybe the lowest 20% of price during the past 2 years. Copy those into a watchlist and then sort by MACD-H to see which ones look to be approaching or coming out of a bottom. Thats just one idea, but I'm sure once you get to playing with it you'll come up with lots more.
|
|
Registered User
Joined: 9/22/2005
Posts: 849
|
Tommie
When I compare your chart of MCCC shown in your post of Saturday, July 7 with my chart, you show six peaks since January 1. My chart shows eight peaks in the same time period.
Can you suggest a reason for the difference? Here is the equation I am using as a percent true to generate the peaks. Is it different than yours?
((C * V + C1 * V1 + C2 * V2 + C3 * V3 + C4 * V4 + C5 * V5 + C6 * V6 + C7 * V7 + C8 * V8 + C9 * V9 + C10 * V10 + C11 * V11 + C12 * V12 + C13 * V13 + C14 * V14 + C15 * V15 + C16 * V16 + C17 * V17 + C18 * V18 + C19 * V19) / (AVGV20 * 20) - AVGC20) * ((C * V + C1 * V1 + C2 * V2 + C3 * V3 + C4 * V4) / (AVGV5 * 5) / AVGC5) * (AVGV5 / AVGV20) > 0 AND ((C1 * V1 + C2 * V2 + C3 * V3 + C4 * V4 + C5 * V5 + C6 * V6 + C7 * V7 + C8 * V8 + C9 * V9 + C10 * V10 + C11 * V11 + C12 * V12 + C13 * V13 + C14 * V14 + C15 * V15 + C16 * V16 + C17 * V17 + C18 * V18 + C19 * V19 + C20 * V20) / (AVGV20.1 * 20) - AVGC20.1) * ((C1 * V1 + C2 * V2 + C3 * V3 + C4 * V4 + C5 * V5) / (AVGV5.1 * 5) / AVGC5.1) * (AVGV5.1 / AVGV20.1) <= 0
|
|
Registered User
Joined: 1/28/2005
Posts: 6,049
|
bcraig
Your % true is a cross of VPCI.
Tommys is a cross of the MACD histogram.
Thanks
diceman
|
|
Registered User
Joined: 12/21/2004
Posts: 902
|
hey - get that VPCI stuff out of my MACD-H thread!!
LOL 
|
|
Registered User
Joined: 9/22/2005
Posts: 849
|
Tommie
When I compare your chart of MCCC shown in your post of Saturday, July 7 with my chart, you show six peaks of what I assume to be a VPCI indicator since January 1. My chart shows eight peaks in the same time period.
Can you suggest a reason for the difference? Here is the equation I am using as a percent true to generate the peaks. Is it different than yours?
((C * V + C1 * V1 + C2 * V2 + C3 * V3 + C4 * V4 + C5 * V5 + C6 * V6 + C7 * V7 + C8 * V8 + C9 * V9 + C10 * V10 + C11 * V11 + C12 * V12 + C13 * V13 + C14 * V14 + C15 * V15 + C16 * V16 + C17 * V17 + C18 * V18 + C19 * V19) / (AVGV20 * 20) - AVGC20) * ((C * V + C1 * V1 + C2 * V2 + C3 * V3 + C4 * V4) / (AVGV5 * 5) / AVGC5) * (AVGV5 / AVGV20) > 0 AND ((C1 * V1 + C2 * V2 + C3 * V3 + C4 * V4 + C5 * V5 + C6 * V6 + C7 * V7 + C8 * V8 + C9 * V9 + C10 * V10 + C11 * V11 + C12 * V12 + C13 * V13 + C14 * V14 + C15 * V15 + C16 * V16 + C17 * V17 + C18 * V18 + C19 * V19 + C20 * V20) / (AVGV20.1 * 20) - AVGC20.1) * ((C1 * V1 + C2 * V2 + C3 * V3 + C4 * V4 + C5 * V5) / (AVGV5.1 * 5) / AVGC5.1) * (AVGV5.1 / AVGV20.1) <= 0
|
|
Registered User
Joined: 1/28/2005
Posts: 6,049
|
bcraig
See my post. The last time you asked.
Thanks
diceman
|
|
|
Guest-1 |