| Welcome Guest, please sign in to participate in a discussion. | Search | Active Topics | |
Registered User
Joined: 11/5/2005
Posts: 180
|
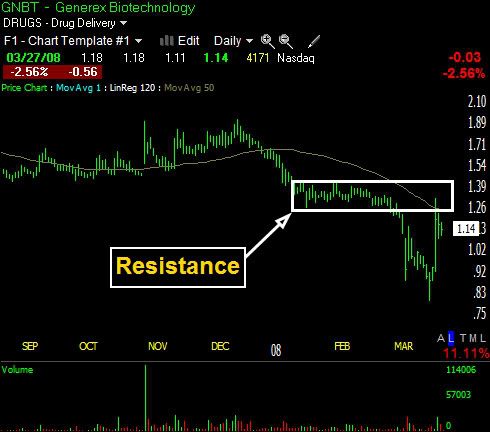
GNBT actually is still in a downtrend. If you view the weekly chart you’ll see even though it popped substantially off support at 1.25 it met strong resistance at 2.14. Draw a line from the high on 5/5/06 (3.25) to the high off 10/10/06 (2.70) and extend it out to the right, you’ll see resistance on 6/13/07 (2.14) showing GNBT’s downward pattern has not been broken. Today GNBT was up .25 in premarket but unable to break the resistance at 2.05 where it eventually closed up .09. If you draw a line from 8/15/06 low (1.25) to 6/11/07 low (1.26) you can see the descending triangle pattern forming since May 2006. In my opinion either the bottom will eventually give out (selloff) or the resistance line will where there may be a nice breakout…we currently are trading in a downtrend descending triangle pattern. I do however feel this week GNBT may break the downward trend, just my view though.
I’m not going to go into great detail about other reasons I like GNBT although I will say I owned it off and on and will probably own (or trade) the stock for awhile. I follow the product line closely and believe it will do well during Phase III trials (just my opinion) but since writing here is more about technical analysis I won’t say anything more about product line and will stick to technical’s, just mentioning this so you know where I’m coming from. So back to technical’s, I noticed that several trades I’ve made after the big run up to $5 were good but none of them stuck, for example the ascending triangle pattern that broke out on 10/9/06 was a good trade, but…eventually failed, I thought I saw a pennant forming afterwards and was preparing to make a purchase when it failed on 12/06/06 which continued the downtrend. So, as I’ve been in GNBT for the big run-up, have made some great trades since (and not some so great trades) what I’m looking for is your thoughts on GNBT turning around, your thoughts if this last pop may be the beginning of some upside. Not explosive 300% gains in one week, I’m not looking for that (although I wouldn’t complain) but rather a substantial breakout with continuous upside over a year or so.
One thing that really scares me is if GNBT sees 1.25 again and loses support I think we could see .80 and that’s scary.
The last GNBT run up GNBT loved staying above its 10DMA which would be nice to see again.
One other thing, what do you think of gaps? I personally believe they get filled, seeing how GNBT only needs to go .06 lower before filling the gap I wouldn’t mind seeing the gap get filled tomorrow.
All feedback is welcome and thanks in advance.
|
|

Registered User
Joined: 10/7/2004
Posts: 2,181
|
Here were my last comments on GNBT made a few weeks ago:
Looking at this in a new way, I now suspect we're headed for <$1 before this turns around.
But by then, I'll think we'll be ready for something significant.
Next to AVNR, this is one of my best finds ever. I think it may be heading back to where I found it the first time; around $0.88. If it gets back to <$1 it could appear to be a perfect Elliot wave on a daily chart.
Now I happen to love fractal theory, so what appears to be a complete Elliot wave on a daily chart, could be seen as only the #2 phase of the 5-step upward move of an Elliot super-cycle.
We'll watch it for a few months. You said, "...it has even failed your set up most of the time...". You're right...and that's excellent news if we're willing to be patient and diligent (two tools as good as or better than most indicators or chart setups).
I've pointed out numerous times on this forum, when I get real buy signals, it usually means something big is going to happen...eventually. Those buy signals are going on for some reason.
I'm going to be watching for OBV to cross above its LR255. May be a very nice ride at that time. If we get a thorough market rinse over the next few weeks/months, it could accelerate GNBT's timing.
|
|
Registered User
Joined: 1/28/2005
Posts: 6,049
|
Right now this appears to be firing on all cylinders.
It looks like there is good long-term support at about
1.35.
Considering the dangers: low-price / bio tech / volume.
This looks like some playable speculation.
I would try and keep it sensible. The wrong news could
probably send this down in a hurry.
Thanks
diceman
|
|
Registered User
Joined: 11/5/2005
Posts: 180
|
Thanks guys, appreciate your thoughts on this.
|
|

Registered User
Joined: 3/21/2006
Posts: 4,308
|
Tobydad, curious how you came up with LR255 for a number? I have only recently (last 3-4 months) been studying OBV as a reliable indicator (with positive results). I like the 30-50 day moving average on the indicator.
During long drawn out downtrends the LR255 does give earlier buy signals then the moving averages,(good example is MED in late May) but in a bottoming formation, long consolidations or up trending stocks, the moving averages give the earlier buy signals. Is this due to the idea that you look for value in the down-trending stocks waiting for the recovery or bounce.
Just curiousity from and old friend.
|
|
Registered User
Joined: 11/5/2005
Posts: 180
|
Gap filled
|
|
Registered User
Joined: 10/7/2004
Posts: 2,181
|
LR255 = approx number of trading days in a year.
I use it mostly for a confirmation indicator. It usually lags my early buy indicators. But when I get the classic "Tobydad profile" and OBV over LR255...Katy bar the door!
|
|
Registered User
Joined: 9/22/2005
Posts: 849
|
tobydad
I missed the "Tobydad profile". Will you post here, please?
|
|
Registered User
Joined: 10/7/2004
Posts: 2,181
|
Wow! Anybody remember where that is? Someone else came up with that name, bcraig, I was using it tongue-in-cheek.
It's my indicator setup. I'll try to find it for you. I think it was on one of the posts where I was talking with Sharkattack among others.
|
|
Registered User
Joined: 12/21/2004
Posts: 902
|
http://www.worden.com/training/default.aspx?g=posts&t=23248
|
|
Registered User
Joined: 9/21/2005
Posts: 566
|
Any current stocks, showing a classic Tobydad?
|
|
Registered User
Joined: 10/7/2004
Posts: 2,181
|
[QUOTE=tobydad]Here were my last comments on GNBT made a few weeks ago:
Looking at this in a new way, I now suspect we're headed for <$1 before this turns around.
But by then, I'll think we'll be ready for something significant.
Next to AVNR, this is one of my best finds ever. I think it may be heading back to where I found it the first time; around $0.88.
Curious that this has finally happened. Now we'll see what comes next. I know everyone may be tired of hearing from me on this but I'd hate for it to take off big time and find out that I didn't sound the "all aboard!".
|
|

Registered User
Joined: 6/6/2005
Posts: 1,157
|
Just thought I'd add my two cents. After seeing that wide range day I thought I'd run the numbers on moves like that and their aftermath as looked at over the last 10 years.
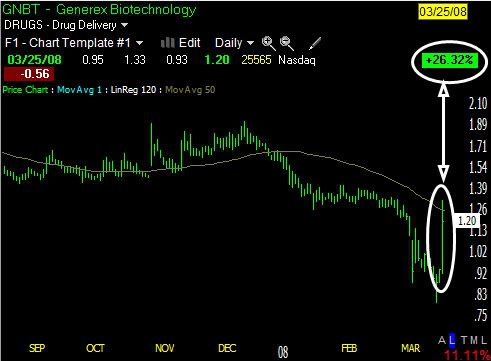
With a 1 day hold, after a gain of 26% or greater...
-325% annualized
-1.2% average
59% bad trades
Sounds like that might be a nice short strategy.
With a 5 day hold:
-179.50 annualized
-3.5% average
63% bad trades
With a 20 day hold:
-20.2% annualized
-1.5% average
58.6% bad trades
Risky to say the least. Keep in mind no stops or profit targets were used with this test. I simply wanted to get an idea of the price movement following such a move. Currently I see that price hit resistence at the 50 day MA.
I was going to run the same scan isolating stocks below $1 but I ran out of time! Maybe later.
Good luck.
David John Hall
|
|
Registered User
Joined: 10/7/2004
Posts: 2,181
|
A conditional buy order over today's high may give a quick profit.
|
|
|
Guest-1 |