|
Bruce
How do I learn more about writing this stuff
|
|
Bruce
What is the difference between the two codes for an inside bar? I use the first one and you wrote the 2nd one for a while ago. Is there an advantage of one over the other?
1. L1<=L and H<=H1
2. (100 * L1) \ 1 <= (100 * L) \ 1 AND (100 * H) \ 1 <= (100 * H1) \ 1
Thanks
JK
|
I use the following codes everday
Hammer
(((H - L) > 3 * (O - C) AND ((C - L) / (.001 + H - L) > 0.6) AND ((O - L) / (.001 + H - L) > 0.6)))
Shooter
(((H - L) > 3 * (O - C) AND ((H-C) / (.001 + H - L) > 0.6) AND ((H-O) / (.001 + H - L) > 0.6)))
|
|
HFC big outsdie day and then falls back into the range over next few days, 2 inside days then another outside day. Above 45.84. If your a ninja you could taken the inside 30 minute hammer at 10:30.
https://www.youtube.com/watch?v=m0ZOJZdmQSo&t=2s
|
|
The thing with break outs to higher highs or lower lows is your at risk of a reversal, that's just the nature of this business.
Do you consider "Time" as an indicator? For example, TSLA this month opened within the previous months range, and was trading down from it's monthly open(305.44), and down from its current weekly open of 306.26. It was trading red across week and month but was conflicted on the daily chart bc Tuesday it closed positive. Today, it gapped down but engulfed the previous days range to the upside, outsdie bar. which changed the week and monthly TF's green. So, now we have "full time continutiy" to the upside but we are still within the previous months range due to Novemebr's 40 dollar plunge.
I like to trade longs that are green for day, week, and the month and just the opposdie for shorts. There are ways to to break this rule but only when times frames are in conflict. I'm not negating my rule, i'm using Time Frame analysis to assist tro capuire and take advantage of traders caught on teh rong side of trade. When you say, Use your brain and your eyes...Don't guess - predicting is a fool's game - observe and follow price.
DVA 12/6 the gap change the trajectory of teh stock to mixed opens on MWD to full tiem continuity(TFC) to the upside. I trade it short through the 2- inside 10 minute bars after 10:00am through $67.00. I deliberately traded against FTC hoping to capture a deep gap fill. It didn't work, even though it was a small loss through the 15 minute hammer. I just waited and let time set up another actionable ssignal. There we multiple inside bars to tiem and a combinations fo a few. 3 inside 15 min bars from 10:45 to 11:30 and a 30 minute inside bar closing at 11:30. A 5 minute inside bar closing at 11:30. I bought through the 5 min bar high and held w stop below that bar. i was really waiting for the 30 to break which it did but it happened a minut before the close of the 5 minute bar. As expected, the price fell in the previous 5 minute bar range at 11:40c. The price took off after the 2nd 5 minute inside bar, surging to the upside. There wsa an actionable signal, a bottom of the hour 60 minute bar, which closed at 11:30 in combination with the 30m. So, price trade through 5, 15 30, and 60 minute insdie bars . The price was postive on the M,W,D and 60m charts
|
|
so much for photobucket, I cant even see my screenshots
|
|
TRV weekly. Inside week and up. You had all week to chase the price to the long side.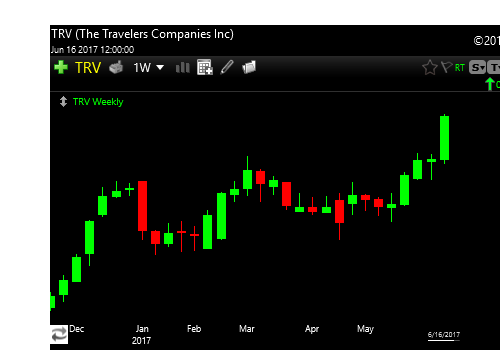
|
|
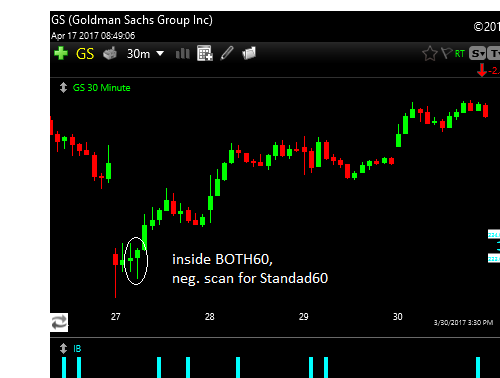
Another example of the bottom of the hour 60 time frame using 30 minute chart. There was no inside 60 minute bar on the standard time frame but the bottom of the hour time(BOTH) was postive. It appears there might of been an inside 30 that broke to the downside but it traded right back up before the BOTHs range wsa taken out. Classical consolidation and then break out?
|
|
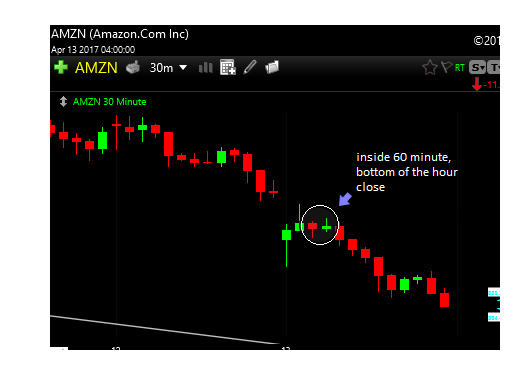
Older AMZN pic, I also use the bottom of the hour 60 minute time frame but on a 30 minute chart. So, the two circled 30 minute bars represents the bottom of the hour open and close and it ranges is clearly within the previous 60 minute bar. I break of the break of that hourly time frames is your entry with the high being your stop. A lot of teh time on smaller time frames there insdie bars and you can use a combination of these actionable signal for your entries and stops.
|
|
I added the "inside bar" condtion as a PCF% true indicator on the bottom of the chart. I just learned how to add pics to the posts, so i'll be posting screenshots as an addiotnal aid . Some will be older but most won't.
|