| Welcome Guest, please sign in to participate in a discussion. | Search | Active Topics | |
Registered User
Joined: 12/12/2009
Posts: 34
|
Dear Trainer,
Can we do Wedge pattern scan (bullish and bearish) on stockfinder. Any help is highly appreciated. 
Thanks
DevTrader
|
|


Worden Trainer
Joined: 10/7/2004
Posts: 65,138
|
I'm not quite sure if it is what you want or not, but while the Finding Continuation Triangles And Wedges With Telechart topic starts by discussing TeleChart techniques, it also presents a series of StockFinder Layouts as well.
-Bruce
Personal Criteria Formulas
TC2000 Support Articles
|
|
Registered User
Joined: 12/12/2009
Posts: 34
|
    I don't see any scans on Stockfinder. I use TeleChart only for chating and socializing due to lot of constraints. I love Stockfinder and like to scan wedge pattern(up and down) . Can you provide me a good solution. I had included a shared chart named as "DevTrader" under shared as an example. thanks and appreciate your help. I don't see any scans on Stockfinder. I use TeleChart only for chating and socializing due to lot of constraints. I love Stockfinder and like to scan wedge pattern(up and down) . Can you provide me a good solution. I had included a shared chart named as "DevTrader" under shared as an example. thanks and appreciate your help.
Devtrader
|
|
Worden Trainer
Joined: 10/7/2004
Posts: 65,138
|
Maybe you just didn't get far enough in the topic. They begin discussing implementing the technique in StockFinder in jas0501's Friday, August 15, 2008 4:30:41 PM ET post (the program was called Blocks at the time), first mention the actual name of a Shared Layout two posts later and Share additional implementations of the technique throughout the rest of the topic.
I've looked at the Chart and it has some Trendlines that you drew after looking at the Chart. The trendlines would appear to be based on your subjective interpretation of the Chart. You "knew it when you saw it."
I can only help you based on an unambiguous objective definition of what you are attempting to identify.
-Bruce
Personal Criteria Formulas
TC2000 Support Articles
|
|
Registered User
Joined: 12/12/2009
Posts: 34
|
Hi Bruce,
Thanks for your response. the solution link Finding Continuation Triangles And Wedges With Telechart topic which you provided talks on Telechart how to scan Wedge pattern. Can I have the same solution in Stockfinder which he talked in two videos
Thanks again for all your contribution.
Devtrader
|
|
Worden Trainer
Joined: 10/7/2004
Posts: 65,138
|
As mentioned earlier, it starts by talking about TeleChart but also presents a series of StockFinder Layouts. I've quoted some of these posts below. You can access the Shared Layouts that are mentioned by selecting Share | Browse other users shared items | Layouts and searching for the name of the Layout (or part of the name of the Layout).
You may also wish to review the AsOf Dragon Layout Ver.s 2.0 topic that is mentioned in the course of the conversation about the StockFinder versions.
QUOTE (jas0501) QUOTE (BobMc)
...
...
...
Hi jas0501 - are you thinking of doing something similar in blocks? If so, I'd be interested in knowing the process, if you'd be so kind.
Regards
Bob Mc
As a matter of fact I did play around with the settings from the video. I then started messing with the chart to get the MA periods as fillins and the LRSs plotted based on a date pointer and then tuneable slope settings for the conditions and the chart got too tricky for a straight foward reverse enginneered dragon. I'll doit it again and share the simple implementation.
Just some Linear Regression Trendlines for the plots and some Linear Regression Slopes for the conditions. I added a weekly view for perspective. The red date pointers mark the same date. I'll share the Layout as David John Hall's Dragon shortly.
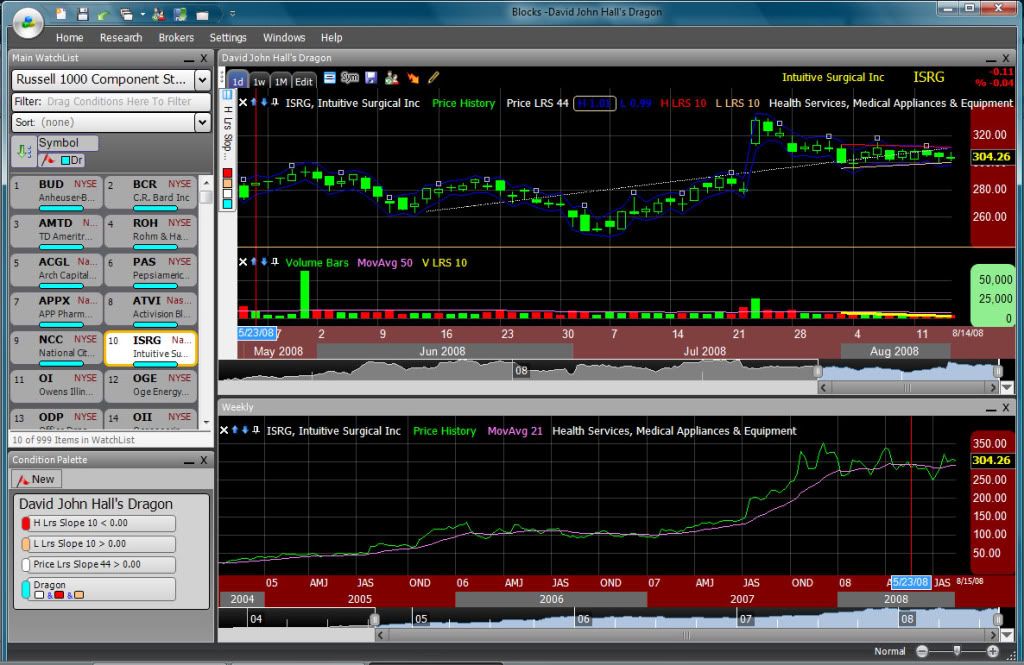
I may need to add a moving average to the daily price chart.
David do my 10 potential dragons match your result today?
QUOTE (jas0501) Uploaded Layout "Dragon of David John Hall Vers. 1.0" to the Blocks share area.
-Bruce
Personal Criteria Formulas
TC2000 Support Articles
|
|
Worden Trainer
Joined: 10/7/2004
Posts: 65,138
|
QUOTE (alindsley) Ok. In Blocks now. Whatta setup. Got one initial question (as I am new to Blocks). How do I hide the Description toolbar (& retrieve it later if so desired)?
And the "Calendar Scroll area? And the right toolbar? I reckon I may need some help locating that weekly chart you spoke of in the last paragraph.
Nice Job
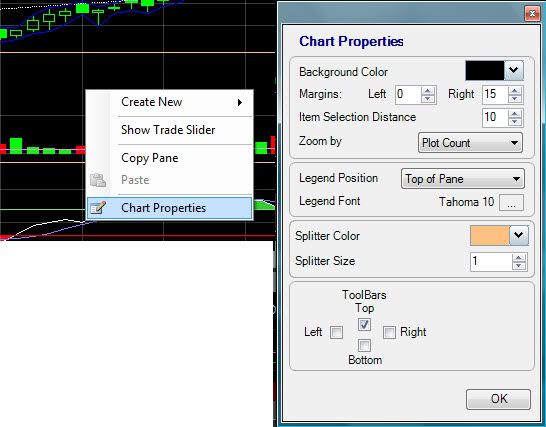
QUOTE (jas0501) alternately you can rigth click and use the Chart properties window to show ot hide tool bars:
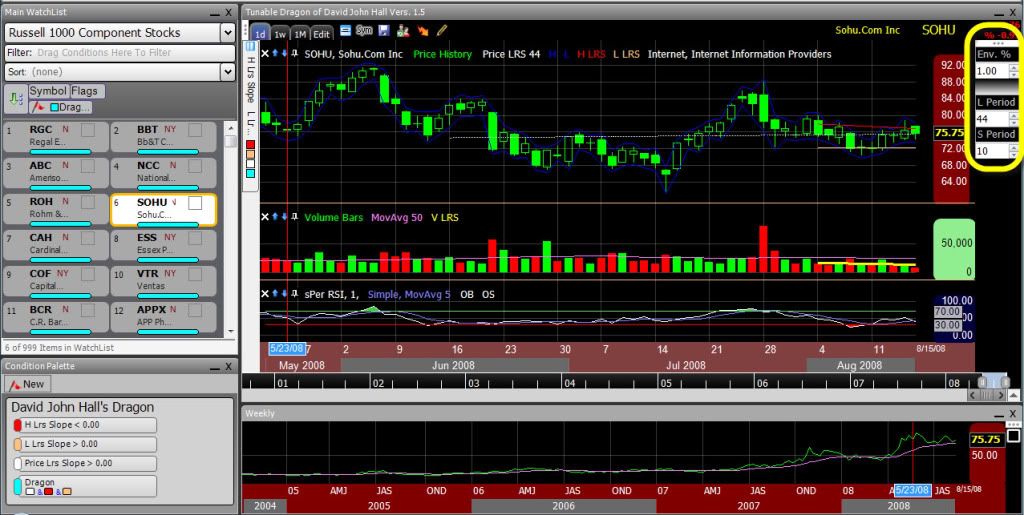
QUOTE (jas0501) FYI, I uploaded version 1.5 of the Dragon on Blocks
This is an update that permits tuning of various settings from the tool bar:
1. Envelope % for the High anf Low price lines
2. Long Period for the long regression line
3. Short Period for the short Regression Line, the volume regrssion line and the RSI period.
It also has Flag field in the watchlist and defaults with the weekly right toolbar displayed allowing toggle of the calendar scoll area.
QUOTE (jas0501) See Blocks 3.1 » General Discussion » AsOf Dragon Layout Ver.s 2.0
for information concerning an update tpo Dragon Vers. 1.5
AsOf Dragon ver 2.0:
This permits setting the calendar view back and advancing until the dragoon arrow is in view. Positioning the date pointer on the arrow draws the regression linesand present the typical view of a dragon apperance. Also computes the x day performance. This permits easy review of numerous dragons to get a better feel for factors contributing to a postivie outcome of the dragon setup.
-Bruce
Personal Criteria Formulas
TC2000 Support Articles
|
|
Worden Trainer
Joined: 10/7/2004
Posts: 65,138
|
QUOTE (jas0501) (C * V + C1 * V1 + C2 * V2 + C3 * V3 + C4 * V4 + C5 * V5 + C6 * V6 + C7 * V7) / (AVGV8 * 8) - AVGC8
I just added to Blocks the equivalent of this using the short period. Here is an outline of the approach.
1. The (C * V + C1 * V1 + C2 * V2 + C3 * V3 + C4 * V4 + C5 * V5 + C6 * V6 + C7 * V7) portion
a. Create a compare indicator of Price * Volume by dragging price to volume and selecting Multiply
b. create a moving average of this. Call it CxVMA for short period moving average
2. The AVGV8 portions is just an MA of Volume. Call it VMA
3. The AVGC8 is just an MA of Price. Call it CMA
'# CxVMA = indicator.MovingAverage.5
'# VMA = indicator.MovingAverage.3
'# CMA = indicator.MovingAverage.4
plot = (CxVMA.value/VMA.value) - CMA.value
As it is declining during the formation of the dragon then wait for the rise in the indicator to confirm a move to the upside.
This can be accompished be taking the linear regression slope of the plot. Just wait for it to ve above zero. I haven't tested this yet but eyeballed some charts and it looks very promising.
Thanks Ptolemy
QUOTE (davidjohnhall) Hi everyone,
I just put together two videos that show, in my opinion, a good way to select the highest probability dragons out of the selections available. I forgot to mention sector rotation and general market timing. Which could go further toward increasing the chances for success.
If the market parten is right...and the sector pattern is right, then move toward looking for those dragons. If the market is in a nose dive and the sectors are in a nose dive, dragon hunting will be that much harder...
Once again...this is a work in progress...and so much great input has flooded in which will only help us all to acheiving greater success in the future.
-Bruce
Personal Criteria Formulas
TC2000 Support Articles
|
|
Worden Trainer
Joined: 10/7/2004
Posts: 65,138
|
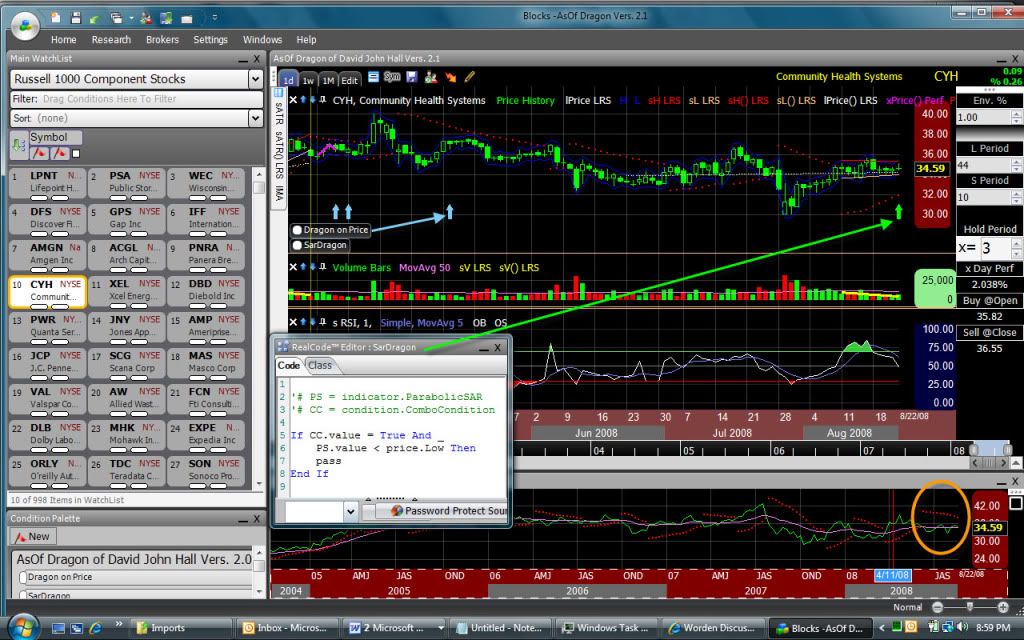
QUOTE (jas0501) Here is a screen shot incorporating David's SAR idea. In addition I added SAR to the monthly chart. This example has the monthly SAR above. This could ba a cautionary indicators.
Also included is the Realcode window showing the condition for Sar Below with Dragon. I modified the condition to use the arrow. The unqualified Dragon is blue, Sar qualified is green.
Side notes:
18 of the 49 Dragons pass the Sar qulification,
I downsized the dots to be size 3 instead of 7.
I minimized the bar for more real estate.
Due to a bug the scan lights are white when arrows are displayed.
QUOTE (jas0501) QUOTE (scottnlena) what is the latest version of the template/workspace?
AsOf Dragon Layout
-Bruce
Personal Criteria Formulas
TC2000 Support Articles
|
|
Worden Trainer
Joined: 10/7/2004
Posts: 65,138
|
QUOTE (jas0501) QUOTE (scottnlena) I made a few additions to the Blocks template and shared them.. a quick linked tab to fundamentals to check earnings and Institutional activity etc etc.
What are the blue arrows?
and the little boxes to the right that say buy opean etc?
Scott,
If all else fails read the documentation:
What are the blue arrows?
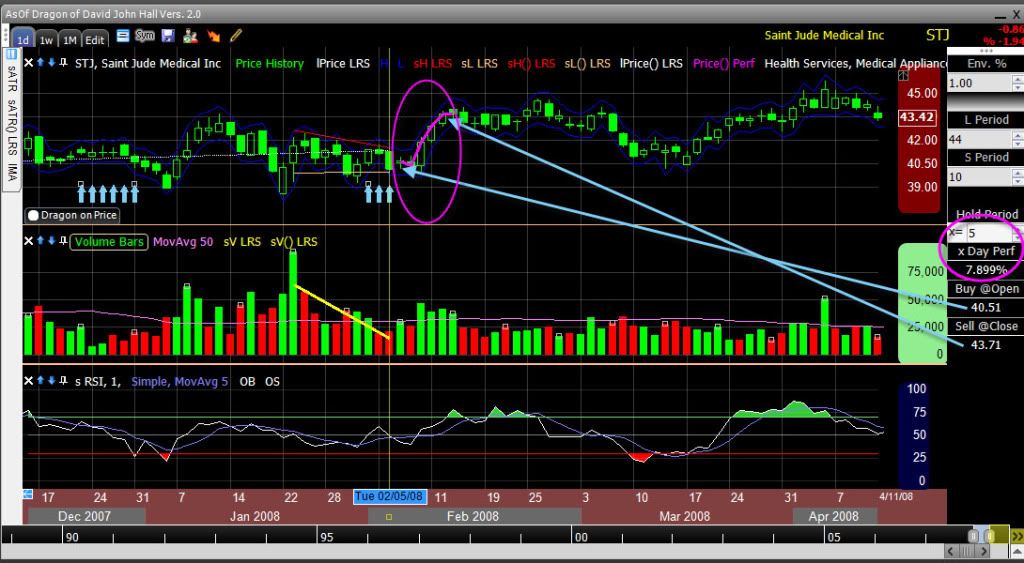
Vers. 2.0 AsOf Dragon reviewer
This is an update that adds:
1. Dynamic linear regression lines based on an AsOf date pointer
2. X day performance based on buy on Open next day and sell at close after x days. The hold period adjustable from the tools bar. Buy and sell prices are listed in the toolbar.
3. Arrow indicators in the price pane for the dragons.
4. A normalized ATR pane hase been added with the ATR pane with the linear regression line using the short period and a moving average using the longe period.
and the little boxes to the right that say buy opean etc?
Vers. 2.0 AsOf Dragon reviewer
This is an update that adds:
1. Dynamic linear regression lines based on an AsOf date pointer
2. X day performance based on buy on Open next day and sell at close after x days. The hold period adjustable from the tools bar. Buy and sell prices are listed in the toolbar.
3. Arrow indicators in the price pane for the dragons.
4. A normalized ATR pane hase been added with the ATR pane with the linear regression line using the short period and a moving average using the longe period.
Dragon 5 day performance as of Tue 02/05/08
-Bruce
Personal Criteria Formulas
TC2000 Support Articles
|
|
Worden Trainer
Joined: 10/7/2004
Posts: 65,138
|
QUOTE (jas0501) Side note regarding exiting: If one adds the Sar indicator it is easy to review AsOf setups and measure performance using the SAR as the exit signal by adjusting the hold period to be as long as the SAR dots are below the price plot.
-Bruce
Personal Criteria Formulas
TC2000 Support Articles
|
|
Worden Trainer
Joined: 10/7/2004
Posts: 65,138
|
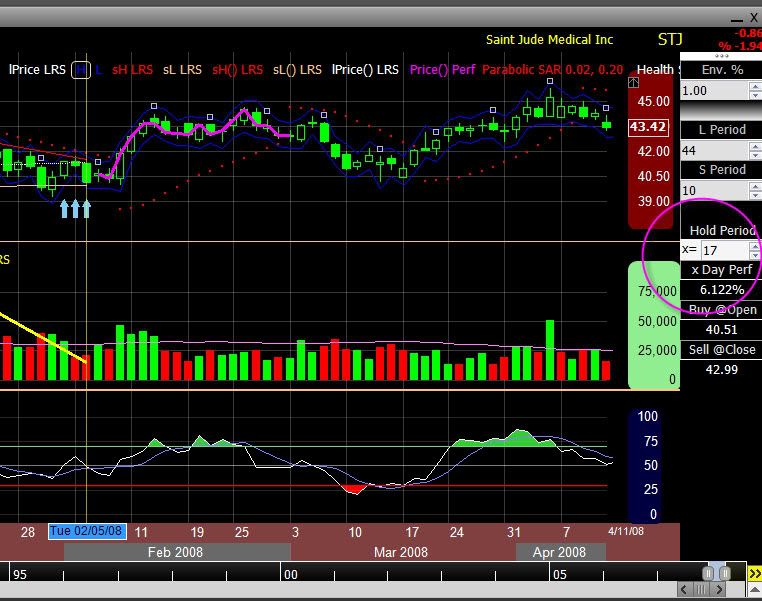
QUOTE (jas0501) To be accurate to David's model the previous exit example would not have entered until the Sar dots were on the bottom. So entry would be on the open of the second dot. Also exit count not occur until close of the fir upper dot. Here is the adjusted AsOf setup for the previous example:
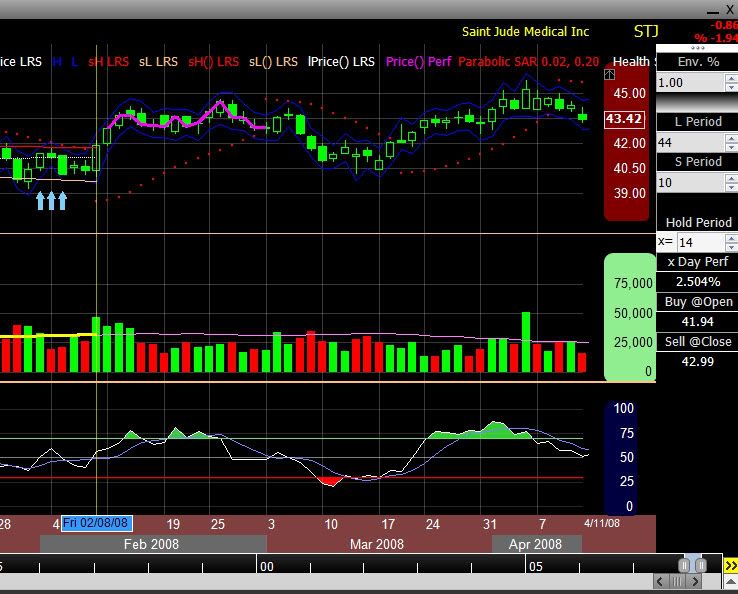
QUOTE (jas0501)
QUOTE (scottnlena) For those of us who can't be there at market open and mabysit the positions?
jas.. great additions.. I'm not certain I understand it however. That is must me.
Moving the date pointer repaints the linear regression lines. The light blue arrows indicate Dragon conditions being satisfied. The pink pricer plot displays the performance for the next x days based on a buy @open Next day from the date pointer, sell @close x days later. The x days is tunable fron the numeric selector. The Buy and Sell prices are listed.
Moving the date pointer to the pointer after the light blue arrow where the first SAR dot below the price occurs will represetn a satified setup. The buy will occur next day open. Adjusting the x day so that the pink price line plots until the first SAR dot above the price will supply the performance of the trade using the SAR signal as the Exit.
The example posted took 3 bars from the Dragon setup until the SAR lower dot and it took 14 bars before the upper dot occurred with a profit of 6.122%
One nneds to adjusted the x=? Hold period to measure the proformance going forward fron the date pointer.
-Bruce
Personal Criteria Formulas
TC2000 Support Articles
|
|
Registered User
Joined: 6/16/2005
Posts: 131
|
Buce - I read the origonal thread and this one and I have 1 queston.
What is the Blocks share area and where do I find it? I searched everywhere to download "Dragon of David John Hall Vers. 1.0" but I hae had no success. Thanks.
|
|
Worden Trainer
Joined: 10/7/2004
Posts: 65,138
|
This is a StockFinder feature and is not in TC2000. Within StockFinder you would select Share | Browse other users shared items from the menus.
-Bruce
Personal Criteria Formulas
TC2000 Support Articles
|
|
|
Guest-1 |