| Welcome Guest, please sign in to participate in a discussion. | Search | Active Topics | |
Registered User
Joined: 6/28/2017
Posts: 68
|
Bruce,
Before today I haven't noticed this. I hope this is one-off instance.
Per other sources DIA closed 9/14 at 221.86, but TC 2000 says 222.32.
SPY closed at 248.86, TC 2000 shows 2.09. XLF closed at 24.70 but TC 2000 shows 24.80.
There could be several more but I don't have time to check. Please note that there can be a one cent disagreement among other sources due to fractions and rounding, but in each case 4 other sources pretty much agree among themselves. The percent disagreement between TC 2000 and the other sources is enough to throw off certain indicators.
I rebooted TC 2000, but the numbers are the same. Is this a known issue? Please advise. Thank you.
|
|


Worden Trainer
Joined: 10/7/2004
Posts: 65,138
|
What sources have you checked?
I have verified the prices of all mentioned symbols with Yahoo Finance, Google Finance, and NYSE.com and the prices match our prices.
-Bruce
Personal Criteria Formulas
TC2000 Support Articles
|
|
Registered User
Joined: 6/28/2017
Posts: 68
|
E*Trade, Big Charts, Stockcharts.com and Yahoo Finance.
|
|
Registered User
Joined: 6/28/2017
Posts: 68
|
Sorry, in my original post I should have written TC2000 shows that SPY closed yesterday at 250.09.
It's yesterday's closing prices, not the current prices, which do match.
|
|


Worden Trainer
Joined: 10/7/2004
Posts: 65,138
|
I can't check E*Trade, but Big Charts and Yahoo Finance match our price. So far, only Stockcharts.com seems to match the prices you are indicating for September 14, 2017.
-Bruce
Personal Criteria Formulas
TC2000 Support Articles
|
|
Registered User
Joined: 6/28/2017
Posts: 68
|
We need to define this. Are you saying that 'your version' of TC2000 shows closing prices for 9/14:
DIA 221.86
SPY 248.86
XLF 24.70
Or does it display the other prices I wrote above? If you are showing the prices in this post, then I have an idea. Thanks!
|
|


Worden Trainer
Joined: 10/7/2004
Posts: 65,138
|
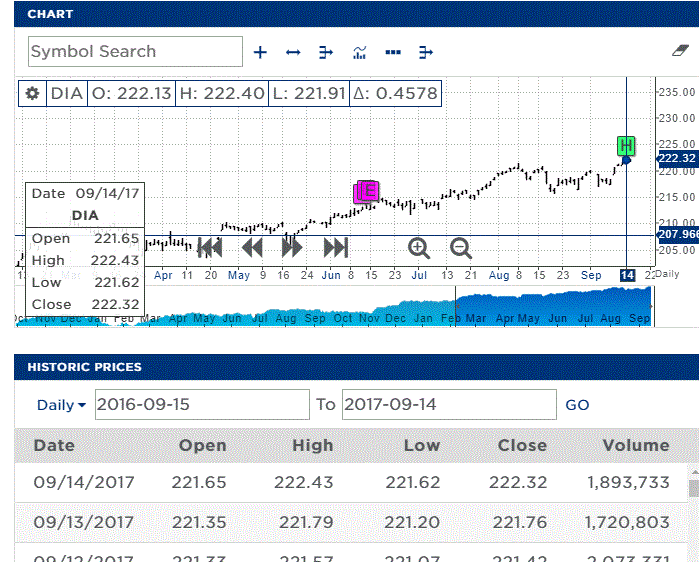
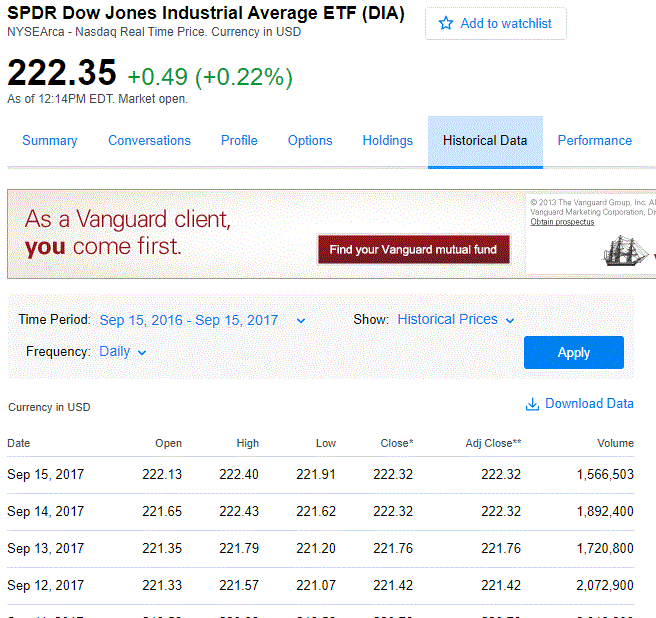
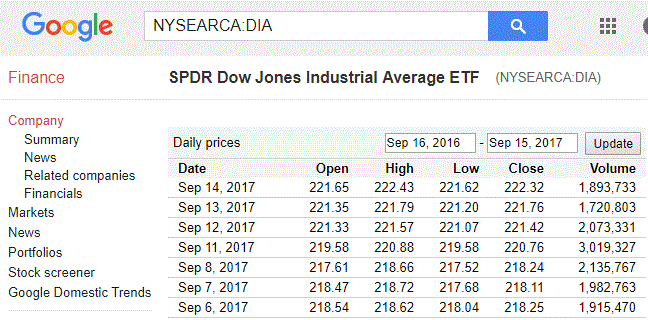
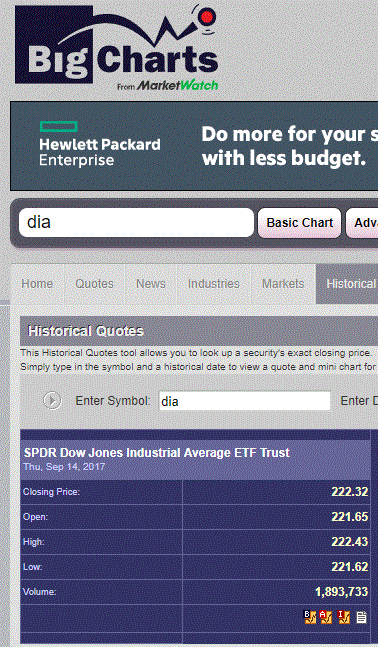
TC2000 shows the following for September 14, 2017 closing prices.
DIA 222.32
SPY 250.09
XLF 24.80
As do Yahoo Finance, Google Finance, Big Charts, and NYSE.com. The outlier appears to be Stockcharts.com (and possibly E*Trade, but I haven't verified that).
-Bruce
Personal Criteria Formulas
TC2000 Support Articles
|
|
Registered User
Joined: 6/28/2017
Posts: 68
|
Bruce,
I feel like I'm in an alternate universe. I agree that TC2000 displays those 9/14 closing prices. I also agree that Stockcharts can be an outlier (it has disagreed with TC2000 and E*Trade in the past when those two matched).
But I just took 9 screenshots of live prices on Yahoo Finance, Google Finance and Big Charts that show the prices I wrote above which differ from TC2000. I don't see a way on the toolbar to upload them, but simple math yields a discrepancy between TC2000 and the 4 sources.
I don't know how to explain the discrepancy between what I'm seeing on the 4 sources and I'm only interested in whether I can trust certain very short term indicators on my TC2000 charts that rely on the prior day's closing price.
My other thought was that I might be getting BATS-only data, because TC2000's closing prices match FreeStockChart's. It was my understanding that by paying the monthly data fee, TC2000's data is based on more than BATS data. Is that true?
This is important to me since I swing trade based on, among other things, very short term general indicators and Worden-proprietary indicators. Thank you for your patience.
|
|


Worden Trainer
Joined: 10/7/2004
Posts: 65,138
|


Attachments:
NYSE.gif - 57 KB, downloaded 447 time(s).
Yahoo.gif - 55 KB, downloaded 425 time(s).
Google.gif - 34 KB, downloaded 453 time(s).
BigCharts.gif - 62 KB, downloaded 393 time(s).
-Bruce
Personal Criteria Formulas
TC2000 Support Articles
|
|
Registered User
Joined: 6/28/2017
Posts: 68
|
Fidelity also agrees on the closes for those 3 ETFs. There is no discrepancy for QQQ, TLT and VXX and probably all others, for all I know. As I said initially, I haven't noticed this before today.
If you're saying that I'm not getting BATS-only data, thank you for confirming that.
It could be that a large Market On Close trade eluded some of the sources (I guess).
I'm moving on, because for the trades I'm in currently, only the (fairly large) discrepancy for SPY matters. Again, thank you for your patience.
|
|


Worden Trainer
Joined: 10/7/2004
Posts: 65,138
|
You aren't getting BATS only data. Even when you have BATS as your RT source, all of the other data gets put into the feed on a fifteen minute delayed basis.
We do appear to be in an alternate universe to some extent since at least Yahoo Finance and Big Charts seem to be giving you different prices than are being reported when I look at the same sources.
One thing to note is that these ETFs have NYSE Arca as the base exchange and NYSE.com agrees with our prices.
-Bruce
Personal Criteria Formulas
TC2000 Support Articles
|
|

Administration
Joined: 9/30/2004
Posts: 9,187
|
Also, SPY and DIA paid dividends today. We do not adjust historical prices for dividends so that will cause some discrepancies in % and net change with sources that do adjust for dividends.
|
|
Registered User
Joined: 6/28/2017
Posts: 68
|
Since I've noticed that XLF's price can flucutate oddly on a Pay Date, that could account for this. The charts of the sources that disagree with TC2000 are clear. SPY is down about 1.00-1.05. But those sources state that it's up .10-.15.
Thanks for the astute observation StockGuy.
|
|
|
Guest-1 |