| Welcome Guest, please sign in to participate in a discussion. | Search | Active Topics | |
 Gold Customer Gold Customer
Joined: 6/29/2005
Posts: 885
|
Hi Bruce..
Im looking to plot a conditiion on my chart to show a cumulative total and not sure how to do it..I can do the individual conditions, but know it takes some sort of ABS values and not sure how to get these in there.
THe conditions are
if Open - Close yesterday <1% of Close Yesterday=TRUE
then add cumulative total Open today -Close Yesterday ( cumulative total)
So essentially, Im looking for a smal body bar, and then want to see how much it gaps up the next day on a cumulative basis.
Thanks.
|
|

Administration
Joined: 9/30/2004
Posts: 9,187
|
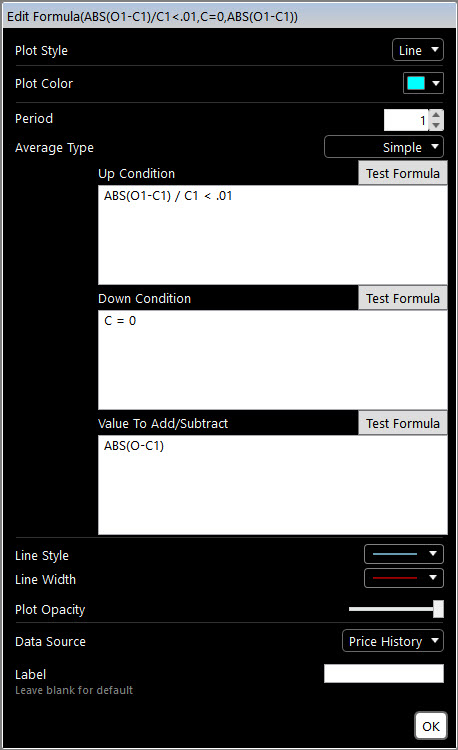
I think what you're looking for can be done with a Custom PCF Cumulative indicator with the following settings:
If you're looking for something different please provide more details.
Attachments:
CustomCumulativePCF.jpg - 66 KB, downloaded 339 time(s).
|
|
Gold Customer
Joined: 6/29/2005
Posts: 885
|
Thanks... Where do I access the custom indicator from.. cant find it in the library..
|
|
Administration
Joined: 9/30/2004
Posts: 9,187
|
It's called a Custom PCF Cumulative Indicator. If you press the / key and type "custom" that will filter the list.
|
|
Gold Customer
Joined: 6/29/2005
Posts: 885
|
Thanks Bruce. THe formula looks right but I dont think its working for what I want.
The plot that I get is straight up, looking like EVERY occurance of a small body bar has been followed by a gap up on ALL stocks which I know cant be right
I need it to calculate in the values for the days the stocks gap down, or dont gap at all, as well as gap up on the days following the small body bar.
|
|

Worden Trainer
Joined: 10/7/2004
Posts: 65,138
|
Try the following settings.
- Up Condition: ABS(O1 - C1) < .01 * C1
- Down Condition: C < C - 1
- Value to Add/Subtract: O - C1
-Bruce
Personal Criteria Formulas
TC2000 Support Articles
|
|
Gold Customer
Joined: 6/29/2005
Posts: 885
|
So the days that a stock gaps down should show up as downticks in the plot..
|
|
Worden Trainer
Joined: 10/7/2004
Posts: 65,138
|
Yes, it should.
-Bruce
Personal Criteria Formulas
TC2000 Support Articles
|
|
|
Guest-1 |