Registered User
Joined: 5/5/2015
Posts: 20
|
Is it possible to have the PPO Historgram color match the Elder Impulse System?
http://www.forex-tsd.com/attachments/indicators-expert-systems-tools/203676d1405864678-macd-indicator-macd-elder-impulse.gif
|
|


Worden Trainer
Joined: 10/7/2004
Posts: 65,138
|
You could try plotting the following Custom PCF Indicators in the same pane and scale as the exponential PPO Histogram 12,26,9 indicator.
- Plot Style: Histogram
- Plot Color: Green
- Period: 1
- Formula: 100 * (XAVGC12 / XAVGC26 - .20019827 * (XAVGC12 / XAVGC26 + .8 * (XAVGC12.1 / XAVGC26.1 + .8 * (XAVGC12.2 / XAVGC26.2 + .8 * (XAVGC12.3 / XAVGC26.3 + .8 * (XAVGC12.4 / XAVGC26.4 + .8 * (XAVGC12.5 / XAVGC26.5 + .8 * (XAVGC12.6 / XAVGC26.6 + .8 * (XAVGC12.7 / XAVGC26.7 + .8 * (XAVGC12.8 / XAVGC26.8 + .8 * (XAVGC12.9 / XAVGC26.9 + .8 * (XAVGC12.10 / XAVGC26.10 + .8 * (XAVGC12.11 / XAVGC26.11 + .8 * (XAVGC12.12 / XAVGC26.12 + .8 * (XAVGC12.13 / XAVGC26.13 + .8 * (XAVGC12.14 / XAVGC26.14 + .8 * (XAVGC12.15 / XAVGC26.15 + .8 * (XAVGC12.16 / XAVGC26.16 + .8 * (XAVGC12.17 / XAVGC26.17 + .8 * (XAVGC12.18 / XAVGC26.18 + .8 * (XAVGC12.19 / XAVGC26.19 + .8 * (XAVGC12.20 / XAVGC26.20 + .8 * (XAVGC12.21 / XAVGC26.21 + .8 * (XAVGC12.22 / XAVGC26.22 + .8 * (XAVGC12.23 / XAVGC26.23 + .8 * (XAVGC12.24 / XAVGC26.24 + .8 * (XAVGC12.25 / XAVGC26.25 + .8 * (XAVGC12.26 / XAVGC26.26 + .8 * (XAVGC12.27 / XAVGC26.27 + .8 * (XAVGC12.28 / XAVGC26.28 + .8 * (XAVGC12.29 / XAVGC26.29 + .8 * (XAVGC12.30 / XAVGC26.30)))))))))))))))))))))))))))))))) / ABS(C > XAVGC13.1 AND XAVGC12 / XAVGC26 - .20019827 * (XAVGC12 / XAVGC26 + .8 * (XAVGC12.1 / XAVGC26.1 + .8 * (XAVGC12.2 / XAVGC26.2 + .8 * (XAVGC12.3 / XAVGC26.3 + .8 * (XAVGC12.4 / XAVGC26.4 + .8 * (XAVGC12.5 / XAVGC26.5 + .8 * (XAVGC12.6 / XAVGC26.6 + .8 * (XAVGC12.7 / XAVGC26.7 + .8 * (XAVGC12.8 / XAVGC26.8 + .8 * (XAVGC12.9 / XAVGC26.9 + .8 * (XAVGC12.10 / XAVGC26.10 + .8 * (XAVGC12.11 / XAVGC26.11 + .8 * (XAVGC12.12 / XAVGC26.12 + .8 * (XAVGC12.13 / XAVGC26.13 + .8 * (XAVGC12.14 / XAVGC26.14 + .8 * (XAVGC12.15 / XAVGC26.15 + .8 * (XAVGC12.16 / XAVGC26.16 + .8 * (XAVGC12.17 / XAVGC26.17 + .8 * (XAVGC12.18 / XAVGC26.18 + .8 * (XAVGC12.19 / XAVGC26.19 + .8 * (XAVGC12.20 / XAVGC26.20 + .8 * (XAVGC12.21 / XAVGC26.21 + .8 * (XAVGC12.22 / XAVGC26.22 + .8 * (XAVGC12.23 / XAVGC26.23 + .8 * (XAVGC12.24 / XAVGC26.24 + .8 * (XAVGC12.25 / XAVGC26.25 + .8 * (XAVGC12.26 / XAVGC26.26 + .8 * (XAVGC12.27 / XAVGC26.27 + .8 * (XAVGC12.28 / XAVGC26.28 + .8 * (XAVGC12.29 / XAVGC26.29 + .8 * (XAVGC12.30 / XAVGC26.30))))))))))))))))))))))))))))))) > XAVGC12.1 / XAVGC26.1 - .20019827 * (XAVGC12.1 / XAVGC26.1 + .8 * (XAVGC12.2 / XAVGC26.2 + .8 * (XAVGC12.3 / XAVGC26.3 + .8 * (XAVGC12.4 / XAVGC26.4 + .8 * (XAVGC12.5 / XAVGC26.5 + .8 * (XAVGC12.6 / XAVGC26.6 + .8 * (XAVGC12.7 / XAVGC26.7 + .8 * (XAVGC12.8 / XAVGC26.8 + .8 * (XAVGC12.9 / XAVGC26.9 + .8 * (XAVGC12.10 / XAVGC26.10 + .8 * (XAVGC12.11 / XAVGC26.11 + .8 * (XAVGC12.12 / XAVGC26.12 + .8 * (XAVGC12.13 / XAVGC26.13 + .8 * (XAVGC12.14 / XAVGC26.14 + .8 * (XAVGC12.15 / XAVGC26.15 + .8 * (XAVGC12.16 / XAVGC26.16 + .8 * (XAVGC12.17 / XAVGC26.17 + .8 * (XAVGC12.18 / XAVGC26.18 + .8 * (XAVGC12.19 / XAVGC26.19 + .8 * (XAVGC12.20 / XAVGC26.20 + .8 * (XAVGC12.21 / XAVGC26.21 + .8 * (XAVGC12.22 / XAVGC26.22 + .8 * (XAVGC12.23 / XAVGC26.23 + .8 * (XAVGC12.24 / XAVGC26.24 + .8 * (XAVGC12.25 / XAVGC26.25 + .8 * (XAVGC12.26 / XAVGC26.26 + .8 * (XAVGC12.27 / XAVGC26.27 + .8 * (XAVGC12.28 / XAVGC26.28 + .8 * (XAVGC12.29 / XAVGC26.29 + .8 * (XAVGC12.30 / XAVGC26.30 + .8 * (XAVGC12.31 / XAVGC26.31))))))))))))))))))))))))))))))))
- Plot Style: Histogram
- Plot Color: Red
- Period: 1
- Formula: 100 * (XAVGC12 / XAVGC26 - .20019827 * (XAVGC12 / XAVGC26 + .8 * (XAVGC12.1 / XAVGC26.1 + .8 * (XAVGC12.2 / XAVGC26.2 + .8 * (XAVGC12.3 / XAVGC26.3 + .8 * (XAVGC12.4 / XAVGC26.4 + .8 * (XAVGC12.5 / XAVGC26.5 + .8 * (XAVGC12.6 / XAVGC26.6 + .8 * (XAVGC12.7 / XAVGC26.7 + .8 * (XAVGC12.8 / XAVGC26.8 + .8 * (XAVGC12.9 / XAVGC26.9 + .8 * (XAVGC12.10 / XAVGC26.10 + .8 * (XAVGC12.11 / XAVGC26.11 + .8 * (XAVGC12.12 / XAVGC26.12 + .8 * (XAVGC12.13 / XAVGC26.13 + .8 * (XAVGC12.14 / XAVGC26.14 + .8 * (XAVGC12.15 / XAVGC26.15 + .8 * (XAVGC12.16 / XAVGC26.16 + .8 * (XAVGC12.17 / XAVGC26.17 + .8 * (XAVGC12.18 / XAVGC26.18 + .8 * (XAVGC12.19 / XAVGC26.19 + .8 * (XAVGC12.20 / XAVGC26.20 + .8 * (XAVGC12.21 / XAVGC26.21 + .8 * (XAVGC12.22 / XAVGC26.22 + .8 * (XAVGC12.23 / XAVGC26.23 + .8 * (XAVGC12.24 / XAVGC26.24 + .8 * (XAVGC12.25 / XAVGC26.25 + .8 * (XAVGC12.26 / XAVGC26.26 + .8 * (XAVGC12.27 / XAVGC26.27 + .8 * (XAVGC12.28 / XAVGC26.28 + .8 * (XAVGC12.29 / XAVGC26.29 + .8 * (XAVGC12.30 / XAVGC26.30)))))))))))))))))))))))))))))))) / ABS(C < XAVGC13.1 AND XAVGC12 / XAVGC26 - .20019827 * (XAVGC12 / XAVGC26 + .8 * (XAVGC12.1 / XAVGC26.1 + .8 * (XAVGC12.2 / XAVGC26.2 + .8 * (XAVGC12.3 / XAVGC26.3 + .8 * (XAVGC12.4 / XAVGC26.4 + .8 * (XAVGC12.5 / XAVGC26.5 + .8 * (XAVGC12.6 / XAVGC26.6 + .8 * (XAVGC12.7 / XAVGC26.7 + .8 * (XAVGC12.8 / XAVGC26.8 + .8 * (XAVGC12.9 / XAVGC26.9 + .8 * (XAVGC12.10 / XAVGC26.10 + .8 * (XAVGC12.11 / XAVGC26.11 + .8 * (XAVGC12.12 / XAVGC26.12 + .8 * (XAVGC12.13 / XAVGC26.13 + .8 * (XAVGC12.14 / XAVGC26.14 + .8 * (XAVGC12.15 / XAVGC26.15 + .8 * (XAVGC12.16 / XAVGC26.16 + .8 * (XAVGC12.17 / XAVGC26.17 + .8 * (XAVGC12.18 / XAVGC26.18 + .8 * (XAVGC12.19 / XAVGC26.19 + .8 * (XAVGC12.20 / XAVGC26.20 + .8 * (XAVGC12.21 / XAVGC26.21 + .8 * (XAVGC12.22 / XAVGC26.22 + .8 * (XAVGC12.23 / XAVGC26.23 + .8 * (XAVGC12.24 / XAVGC26.24 + .8 * (XAVGC12.25 / XAVGC26.25 + .8 * (XAVGC12.26 / XAVGC26.26 + .8 * (XAVGC12.27 / XAVGC26.27 + .8 * (XAVGC12.28 / XAVGC26.28 + .8 * (XAVGC12.29 / XAVGC26.29 + .8 * (XAVGC12.30 / XAVGC26.30))))))))))))))))))))))))))))))) < XAVGC12.1 / XAVGC26.1 - .20019827 * (XAVGC12.1 / XAVGC26.1 + .8 * (XAVGC12.2 / XAVGC26.2 + .8 * (XAVGC12.3 / XAVGC26.3 + .8 * (XAVGC12.4 / XAVGC26.4 + .8 * (XAVGC12.5 / XAVGC26.5 + .8 * (XAVGC12.6 / XAVGC26.6 + .8 * (XAVGC12.7 / XAVGC26.7 + .8 * (XAVGC12.8 / XAVGC26.8 + .8 * (XAVGC12.9 / XAVGC26.9 + .8 * (XAVGC12.10 / XAVGC26.10 + .8 * (XAVGC12.11 / XAVGC26.11 + .8 * (XAVGC12.12 / XAVGC26.12 + .8 * (XAVGC12.13 / XAVGC26.13 + .8 * (XAVGC12.14 / XAVGC26.14 + .8 * (XAVGC12.15 / XAVGC26.15 + .8 * (XAVGC12.16 / XAVGC26.16 + .8 * (XAVGC12.17 / XAVGC26.17 + .8 * (XAVGC12.18 / XAVGC26.18 + .8 * (XAVGC12.19 / XAVGC26.19 + .8 * (XAVGC12.20 / XAVGC26.20 + .8 * (XAVGC12.21 / XAVGC26.21 + .8 * (XAVGC12.22 / XAVGC26.22 + .8 * (XAVGC12.23 / XAVGC26.23 + .8 * (XAVGC12.24 / XAVGC26.24 + .8 * (XAVGC12.25 / XAVGC26.25 + .8 * (XAVGC12.26 / XAVGC26.26 + .8 * (XAVGC12.27 / XAVGC26.27 + .8 * (XAVGC12.28 / XAVGC26.28 + .8 * (XAVGC12.29 / XAVGC26.29 + .8 * (XAVGC12.30 / XAVGC26.30 + .8 * (XAVGC12.31 / XAVGC26.31))))))))))))))))))))))))))))))))
-Bruce
Personal Criteria Formulas
TC2000 Support Articles
|
|
Registered User
Joined: 5/5/2015
Posts: 20
|
Awesome. Ingenious.
Thank You.
|
|
Registered User
Joined: 10/19/2004
Posts: 21
|
Bruce - Your PCF for Elder Impulse works great laid over the PPO. Do you have a similar PCF that can be overlaid on the MACD histogram 12,26,9?
|
|
Worden Trainer
Joined: 10/7/2004
Posts: 65,138
|
You could try plotting the following Custom PCF Indicators in the same pane and scale as the exponential MACD Histogram 12,26,9 indicator set to blue.
- Plot Style: Histogram
- Plot Color: Green
- Period: 1
- Formula: (XAVGC12 - XAVGC26 - XAVG(XAVGC12,9) + XAVG(XAVGC26,9)) / ABS(C > XAVGC13.1 AND XAVGC12 - XAVGC26 - XAVG(XAVGC12,9) + XAVG(XAVGC26,9) > XAVGC12.1 - XAVGC26.1 - XAVG(XAVGC12.1,9) + XAVG(XAVGC26.1,9))
- Plot Style: Histogram
- Plot Color: Red
- Period: 1
- Formula: (XAVGC12 - XAVGC26 - XAVG(XAVGC12,9) + XAVG(XAVGC26,9)) / ABS(C < XAVGC13.1 AND XAVGC12 - XAVGC26 - XAVG(XAVGC12,9) + XAVG(XAVGC26,9) < XAVGC12.1 - XAVGC26.1 - XAVG(XAVGC12.1,9) + XAVG(XAVGC26.1,9))
-Bruce
Personal Criteria Formulas
TC2000 Support Articles
|
|
Registered User
Joined: 10/19/2004
Posts: 21
|
Bruce-Thanks for the quick help. Works perfectly (as always).
|
|
Registered User
Joined: 3/18/2010
Posts: 35
|
Is it possible to apply the colors to the price chart instead of the histogram?
|
|
Worden Trainer
Joined: 10/7/2004
Posts: 65,138
|
We could place colored dots on the price chart, but it is not possible to paint the price plot itself based on the Elder Impulse colors.
-Bruce
Personal Criteria Formulas
TC2000 Support Articles
|
|
Registered User
Joined: 3/18/2010
Posts: 35
|
So how do you do the colored dots?
|
|
Worden Trainer
Joined: 10/7/2004
Posts: 65,138
|
You would need to decide where on the price pane you wanted to plot the dots. Do you want them to plot on the closing price, the high, the low or different locations depending on the color?
I would also need to know if you want the colors based on PPO or MACD.
-Bruce
Personal Criteria Formulas
TC2000 Support Articles
|
|
Registered User
Joined: 3/18/2010
Posts: 35
|
I'm not sure how to answer your reply but this is my understanding of it:
-
Trend = the Slope of the 13-period EMA
-
Momentum = the Slope of the MACD Histogram
-
If Trend and Momentum are both UP, color the bar GREEN
-
If Trend and Momentum are both DOWN, color the bar RED
-
If Trend and Momentum disagree, color the bar BLUE.
Note that Stockcharts has this feature on their free charts with the price charts color coded. I'm surprised it's so difficult in TC2000.
|
|
Worden Trainer
Joined: 10/7/2004
Posts: 65,138
|
You will want to plot the following Custom PCF Indicators in the same pane and scale as price.
- Plot Style: Dot
- Plot Color: Green
- Period: 1
- Formula: C / ABS(C > XAVGC13.1 AND 119 * C + 765 * XAVGC12.1 > 65 * XAVGC26.1 + 819 * XAVGC9.1)
- Plot Style: Dot
- Plot Color: Red
- Period: 1
- Formula: C / ABS(C < XAVGC13.1 AND 119 * C + 765 * XAVGC12.1 < 65 * XAVGC26.1 + 819 * XAVGC9.1)
- Plot Style: Dot
- Plot Color: Blue
- Period: 1
- Formula: C / ABS(SGN(C - XAVGC13.1) <> SGN(119 * C + 765 * XAVGC12.1 - 65 * XAVGC26.1 - 819 * XAVGC9.1))
-Bruce
Personal Criteria Formulas
TC2000 Support Articles
|
|
Registered User
Joined: 3/18/2010
Posts: 35
|
Thanks Bruce. I understand how to create the custom PCF but how do I do:
- Plot Style: Dot
- Plot Color: Green
- Period: 1
|
|
Registered User
Joined: 3/18/2010
Posts: 35
|
I was able to figure it out. Bruce, thanks for much for your help!
|
|
Worden Trainer
Joined: 10/7/2004
Posts: 65,138
|
You're welcome. I am happy to read you were able to figure it out on your own.
-Bruce
Personal Criteria Formulas
TC2000 Support Articles
|
|
Registered User
Joined: 5/5/2015
Posts: 20
|
Hi Bruce,
I'd like to turn those three PCF's into an indicator. When I overlay the 3 PCF's, the dots are at different heights/values. Can you modify the formulas so that when overlayed, they produce a straight horizontal line of different colored dots?
thank you
|
|
Worden Trainer
Joined: 10/7/2004
Posts: 65,138
|
Replace the C before the / at the beginning of each formula in the Tuesday, November 24, 2015 4:52:49 PM ET post with an arbitrary number (maybe 100).
-Bruce
Personal Criteria Formulas
TC2000 Support Articles
|
|
Registered User
Joined: 2/25/2014
Posts: 41
|
QUOTE (Bruce_L)
You will want to plot the following Custom PCF Indicators in the same pane and scale as price.
- Plot Style: Dot
- Plot Color: Green
- Period: 1
- Formula: C / ABS(C > XAVGC13.1 AND 119 * C + 765 * XAVGC12.1 > 65 * XAVGC26.1 + 819 * XAVGC9.1)
- Plot Style: Dot
- Plot Color: Red
- Period: 1
- Formula: C / ABS(C < XAVGC13.1 AND 119 * C + 765 * XAVGC12.1 < 65 * XAVGC26.1 + 819 * XAVGC9.1)
- Plot Style: Dot
- Plot Color: Blue
- Period: 1
- Formula: C / ABS(SGN(C - XAVGC13.1) <> SGN(119 * C + 765 * XAVGC12.1 - 65 * XAVGC26.1 - 819 * XAVGC9.1))
Dear Bruce! Please advise how i should amend the formula by using 7 period RSI instead or Momentum?
|
|
Worden Trainer
Joined: 10/7/2004
Posts: 65,138
|
I am not quite sure what you are asking. The Elder Impulse colors happen due to very specific requirements. So if you want to use RSI or momentum to put colored dots on price, we would need a lot more information on how you want to determine the colors.
If you just want to plot the colored dots on another indicator instead of price, you would replace the C at the beginning of the formula with a formula for the indicator you want to use.
So:
C / ABS(C > XAVGC13.1 AND 119 * C + 765 * XAVGC12.1 > 65 * XAVGC26.1 + 819 * XAVGC9.1)
Becomes the following for a plain RSI 7:
RSI7 / ABS(C > XAVGC13.1 AND 119 * C + 765 * XAVGC12.1 > 65 * XAVGC26.1 + 819 * XAVGC9.1)
If it is a compound fomrula, it would need to put in parentheses. For example, if you wanted to plot the price at the midpoint of the price bar instead of the close.
(H + L) / 2 / ABS(C > XAVGC13.1 AND 119 * C + 765 * XAVGC12.1 > 65 * XAVGC26.1 + 819 * XAVGC9.1)
-Bruce
Personal Criteria Formulas
TC2000 Support Articles
|
|
Registered User
Joined: 2/25/2014
Posts: 41
|
Bruce,
the formula above are based on EMA and MACD Histogram. I'd like to amend it by replacing MACD for 7 period RSI. Hope i did answer your question.
|
|
Worden Trainer
Joined: 10/7/2004
Posts: 65,138
|
An interesting thing about a Wilder's smoothed RSI is that it will go up when C > C1 and down when C < C1 no matter what its period.
So green would just be:
C / ABS(C > XAVGC13.1 AND C > C1)
Red would be:
C / ABS(C < XAVGC13.1 AND C < C1)
And blue would be:
C / ABS(SGN(C - XAVGC13.1) <> SGN(C - C1))
If it is the plain RSI without Wilder's smoothing then green would be:
C / ABS(C > XAVGC13.1 AND RSI7 > RSI7.1.1)
Red would be:
C / ABS(C < XAVGC13.1 AND RSI7 < RSI7.1.1)
And blue would be:
C / ABS(SGN(C - XAVGC13.1) <> SGN(RSI7 - RSI7.1.1))
-Bruce
Personal Criteria Formulas
TC2000 Support Articles
|
|
Registered User
Joined: 2/25/2014
Posts: 41
|
Dear Bruce,
sorry for bothering you, but dibn't you think to insttal the well know and perfect working BOP into VER 17. The indicator are very great. Expecially the fact that Worden brothers created it and other people steal the idea?
If not, coudld you please sen me to a revelant page where i can learn how to wrtite ?
Thank you !
|
|
Administration
Joined: 9/30/2004
Posts: 9,187
|
Balance of Power is available in version 17.
|
|
Registered User
Joined: 2/25/2014
Posts: 41
|
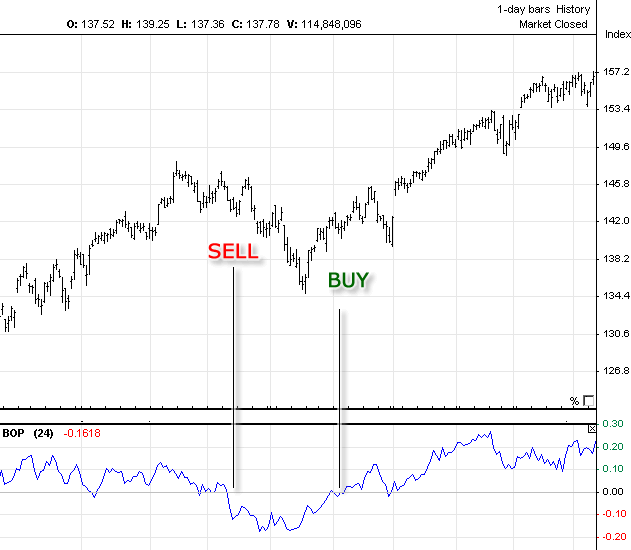
Yes, i know that since i start using the program. but its works as a histotram and i need the bars should be marked red-yellow-green.
|
|
Administration
Joined: 9/30/2004
Posts: 9,187
|
BOP plots the same way in version 7 and 17. Chart is from 17 and the BOP from 7 posted below.
Attachments:
BOP.gif - 35 KB, downloaded 1,437 time(s).
|
|
Administration
Joined: 9/30/2004
Posts: 9,187
|
Ah, you mean color the price bars the same. Forgot v7 does that.
|
|
Registered User
Joined: 2/25/2014
Posts: 41
|
It does perfectly! Please see attached.
|
|
Registered User
Joined: 2/25/2014
Posts: 41
|

|
|
Registered User
Joined: 2/25/2014
Posts: 41
|
Please allow to ask one more question. Whether is possible to create such an indicator (or something similar) by using TC2000 17 (it looks like an oscillator):
|
|
Administration
Joined: 9/30/2004
Posts: 9,187
|
Sure, just change the plot style on BOP from Histogram to Line.
|
|
Registered User
Joined: 2/25/2014
Posts: 41
|
Thank you so much Sir!
|
|
Registered User
Joined: 2/25/2014
Posts: 41
|
QUOTE (Alex_rich)
QUOTE (Bruce_L)
You will want to plot the following Custom PCF Indicators in the same pane and scale as price.
- Plot Style: Dot
- Plot Color: Green
- Period: 1
- Formula: C / ABS(C > XAVGC13.1 AND 119 * C + 765 * XAVGC12.1 > 65 * XAVGC26.1 + 819 * XAVGC9.1)
- Plot Style: Dot
- Plot Color: Red
- Period: 1
- Formula: C / ABS(C < XAVGC13.1 AND 119 * C + 765 * XAVGC12.1 < 65 * XAVGC26.1 + 819 * XAVGC9.1)
- Plot Style: Dot
- Plot Color: Blue
- Period: 1
- Formula: C / ABS(SGN(C - XAVGC13.1) <> SGN(119 * C + 765 * XAVGC12.1 - 65 * XAVGC26.1 - 819 * XAVGC9.1))
Dear Bruce! Please advise how i should amend the formula by using 7 period RSI instead or Momentum?
Dear Bruce can you please amend the romua by leaving MACD and replace Exp MA by Front weigheted moving average?
|
|
Administration
Joined: 9/30/2004
Posts: 9,187
|
You can just replace XAVG with FAVG everywhere you want front-weighted instead of exponential. Note, this will only work in version 17.
|
|
Registered User
Joined: 2/25/2014
Posts: 41
|
My version is 16.0.036
I looked at help menu. Also i did try to replace for FAVG as you wrote before,but the program told there is a mistake.
|
|
Administration
Joined: 9/30/2004
Posts: 9,187
|
Version 17 is required to use the FAVG function. You can download it here http://www.tc2000.com/download
|
|
Registered User
Joined: 2/25/2014
Posts: 41
|
I gor 17 version now. BUT one formula which shows trend shows error. Maybe because i delete "C" capital after FAVG?
|
|
Administration
Joined: 9/30/2004
Posts: 9,187
|
Don't remove the C, just replace XAVG with FAVG.
|
|
Registered User
Joined: 2/25/2014
Posts: 41
|
It written wromg method AGVCC
The rimula as follows:
C / ABS(C > FAVGC22.1 AND 119 * C + 765 * FAVGC12.1 > 65 * FAVGC50.1 + 819 * FAVGCC9.1)
|
|
Registered User
Joined: 2/25/2014
Posts: 41
|
OH! My bad double C .... How i can amend period for 11 instead 22?
|
|
Worden Trainer
Joined: 10/7/2004
Posts: 65,138
|
OK. You are interested in price being above the 11 period front weighted moving average and a front weighted MACD 12, 50, 9 Histogram moving up (I'm just guessing based on the numbers in your formula)?
IIF(C > FAVGC22 AND FAVGC12 - FAVGC50 - FAVG(FAVGC12 - FAVGC50, 9) > FAVGC12.1 - FAVGC50.1 - FAVG(FAVGC12.1 - FAVGC50.1, 9), C, 1 / 0)
-Bruce
Personal Criteria Formulas
TC2000 Support Articles
|
|
|
Guest-1 |