| Welcome Guest, please sign in to participate in a discussion. | Search | Active Topics | |
Registered User
Joined: 11/19/2012
Posts: 3
|
I started using the Parabolic Sar chart today for my day trading activities (RIMM stock). This stock is in upward trend but the tool is giving me late entry points and late exit points causing me to either break even or in one case lose money. It's also losing great opportunities not picking up chances to change the indicators directions earlier.
1. Why is this? For example I'm paying too much for the stock and I'm also not getting the most for it when I'm told to exit. It's keeping me in too long. I've reviewed previous data and this problem seems to be a trend not only for RIMM but for other stocks and regardelss of the timeframes.
My second question is I've played around with the various time frames 1 min 5 min and 10 min. This didn't help.
2. What is the best time frame I should use to improve my entry points for day trading and swing trading?
3. What other analysis tools should I also have up to confirm the information being displayed?
Thanks Jennifer
|
|


Worden Trainer
Joined: 10/7/2004
Posts: 65,138
|
The trainers can't give setting, interpretation or investment advice. I will move this topic to the Stock and Market Talk forum so other traders will be more likely to see it and comment.
-Bruce
Personal Criteria Formulas
TC2000 Support Articles
|
|
Registered User
Joined: 11/19/2012
Posts: 3
|
QUOTE (Bruce_L) Bruce thank you for passing my posting on. Hopefully others will comment. Today with all the technical difficulties and this tool not working as I expected today has not been profitable.
First let me say I was not looking for investment advice. Sorry if I gave you that impression.
I just wanted to understand how the tool works. I thought a trainers role was to help clients understand the purpose of the analysis tool, the options we have with the various settings, and how to intrepret the information it displays for us. Particularly I wanted to understand why it might display so dramatically different from setting to setting as it did for me today.
I have watched training videos where another trainer has talked about groups of analysis tools that compliment each other so I didn't think it was inappropriate to ask.
The trainers can't give setting, interpretation or investment advice. I will move this topic to the Stock and Market Talk forum so other traders will be more likely to see it and comment.
Bruce I'm not asking for investment advice. I'm trying to understand how this particular tool best works.
What is the role of trainer if you can't comment on the sentivity of settings we have to choose from. Are you able to comment on that and explain why the information is changing so much from one setting to another. For example 1 min say its in an up trend 5 min says its in a down trend.
|
|
Worden Trainer
Joined: 10/7/2004
Posts: 65,138
|
I cannot tell you what indicators you should use (or which are "best") or what settings to use for the indicators you have chosen to use for any particular purpose (or in general for that matter). Whether or not you agree with the assessment, this falls under the category of investment or setting advice and I cannot provide either one.
Our role is to provide information about our software, not about investing.
We can explain how an indicator is calculated even if we can't tell you which indicator or settings to use. We can explain how to add an indicator with your settings to the chart and create conditions, EasyScans, WatchList Columns and sorts based on that indicator and its settings. We can even help you create your own custom indicators, conditions, EasyScans, WatchList Columns and sorts based on your unambiguous definitions (but we really can't help you come up with those definitions).
That differing time frames or settings return different results for the same indicator is not surprising. A stock can be down over the course of day and still up over the course of a week or a month for example.
As a general rule, shorter time frames and periods are more sensitive than longer time frames and periods and will provide earlier signals. This sensitivity usually comes with a price however. A more sensitive indicator is more likely to give false signals because there isn't enough data being used to confirm those signals. Where you want to make these tradeoffs is a very personal matter.
-Bruce
Personal Criteria Formulas
TC2000 Support Articles
|
|
Registered User
Joined: 11/19/2012
Posts: 3
|
QUOTE (Bruce_L)
I cannot tell you what indicators you should use (or which are "best") or what settings to use for the indicators you have chosen to use for any particular purpose (or in general for that matter). Whether or not you agree with the assessment, this falls under the category of investment or setting advice and I cannot provide either one.
Our role is to provide information about our software, not about investing.
We can explain how an indicator is calculated even if we can't tell you which indicator or settings to use. We can explain how to add an indicator with your settings to the chart and create conditions, EasyScans, WatchList Columns and sorts based on that indicator and its settings. We can even help you create your own custom indicators, conditions, EasyScans, WatchList Columns and sorts based on your unambiguous definitions (but we really can't help you come up with those definitions).
That differing time frames or settings return different results for the same indicator is not surprising. A stock can be down over the course of day and still up over the course of a week or a month for example.
As a general rule, shorter time frames and periods are more sensitive than longer time frames and periods and will provide earlier signals. This sensitivity usually comes with a price however. A more sensitive indicator is more likely to give false signals because there isn't enough data being used to confirm those signals. Where you want to make these tradeoffs is a very personal matter.
Thank you Bruce the "general rule" comment was helpful. That's the kind of information I was looking for.
|
|
Worden Trainer
Joined: 10/7/2004
Posts: 65,138
|
You're welcome. Othere traders will hopefully be able to pipe in with better advice than I am able to give however.
-Bruce
Personal Criteria Formulas
TC2000 Support Articles
|
|

Registered User
Joined: 2/5/2006
Posts: 1,148
|
try a 5 min chart
|
|
Registered User
Joined: 12/31/2005
Posts: 2,499
|
When is the best time to plant crops?
It depends on the weather, both past and future and no one can predict the future.
--------------------------------
If the SAR settings were obvious the market would exploit the opportunity. The fowllowing is an outline for doing a study and deriving a sense of what criteria might guide the setting and use of the SAR.
Backtesting is one way to derive an answer. Also the recent behavior of the stock may also permit classification of those circumstances where the Parabolic SAR behaves in a more predictable manner.
Via backtesting if one composed a large set of trades where the SAR behaved poorly and another large set of trade where is behaved well, one could plot the average price trajectory n bars before entry and maybe decern a viable pattern for entry and/or for SAR settings.
Given a large enough set entry, one could partition these based on some indicator value. One to consider and normalised ATR. Another is the moving average slope. For example given 100,000 entries take the range of moving averae slopes and split into 20 sets of 5,000 trades based on the slope. Then plot the average price trajectory of each of these and and see there is a sweet range where the performance is better.
This is what was done in the Simple Timing trick, 10 day low study in Short term timing trick. The result being that the extreme ends of the moving average slope were where the 10 day low trade perfromed best.
|
|

Registered User
Joined: 6/6/2005
Posts: 1,157
|
For example 1 min say its in an up trend 5 min says its in a down trend
You can have different trends on different time frames. That doesn't mean an indicator doesn't work (though most don't). As jas said, it's your job to find out which parameters work best.
Would SAR work best if both the 5min and the 1min were in an uptrend? If the 5min were in a downtrend and the 1min in an uptrend? If the weekly was in a downtrend but the daily is in an uptrend?
Do you see? That's where the work comes in. You look at the time frame you are trading on -- say 1min -- then you look to other time frames for confirmation. But it's up to you to determine what that confirmation would be.
If you are tradig the 1 min and sar is in an uptrend and you look at the 5min chart and its in a downtrend -- is that good or bad? Only your study and testing will tell you.
Here are a couple charts with multimple time frames on them. The first is the spy. All SARS in an uptrend...
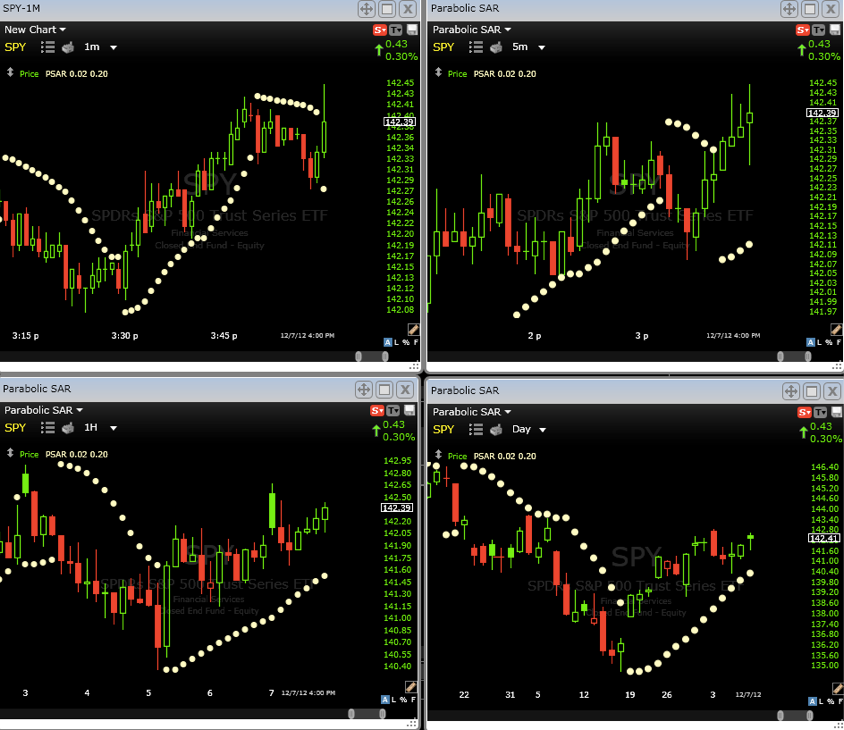
Is that good or bad. You might say good. You might say, I wait for all signals to be positive, and then when I get a buy on the 1 minte -- like we just had -- I take that signal. And I trade it until I get a sell on the 1 minute.
A lot of traders look for higher time frame confirmation -- so that might be good. Here's the same charts for AAPL:
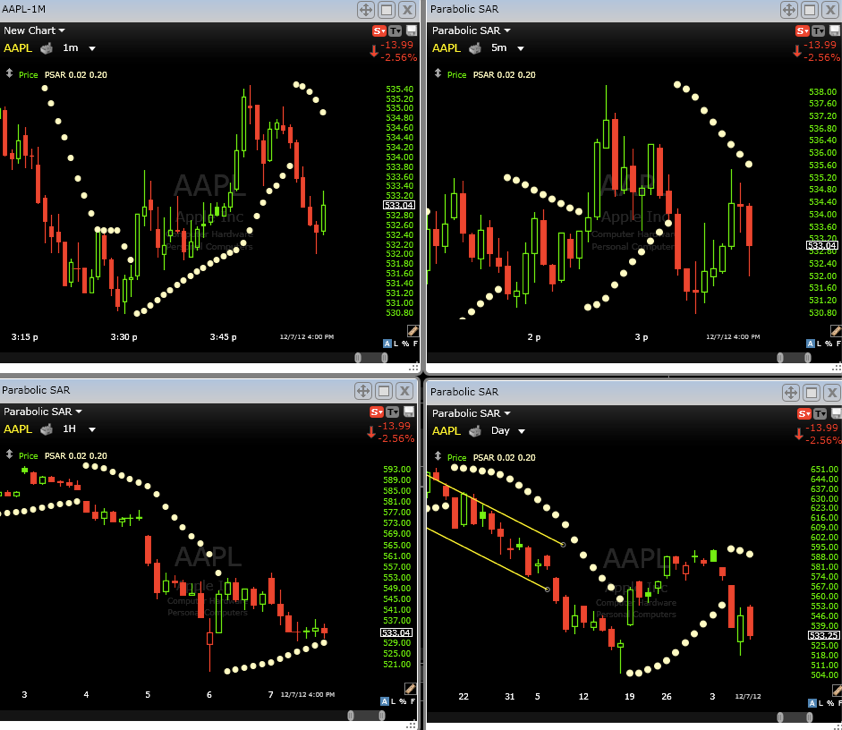
Everything is in a downtrend except for the hourly time frame. Is that good or bad? Once again, up to you to do the testing or the trading -- and to learn it.
One way you might trade this is look to the daily and say -- AAPL is in a downtrend on the daily chart -- I'm only going to take short sell signals on the lower time frames and ignore the buy signals.
You can do that with the 5 minute as well. You can say, when the 5 minute chart shows a buy signal, I'm only going to take buy signals on the 1 minute chart.
Your testing might show that when the 5 minute chart shows a sell signal that the BUY signals perform best on the 1 minute chart.
Do you see how many options there are? A lot.
Another thing to take into consideration is the signal on the general market. What does it mean for buy signals on individual stocks when the entire general market is showing a sell signal? Or vice versa?
All of these things matter -- but you have to figure out how they matter for you.
Good luck!
David John Hall
|
|
Registered User
Joined: 2/5/2006
Posts: 1,148
|
he must be totally confused after reading all this. i know i am.
if you're daytrading, i would think most other timeframes would be irrelevant, other than the timeframe directly above and below the timeframe you're trading off., and especially since your trade only lasts a few hours.
the main indicaters are simply price and volume.
the problem with daytrading is stocks can gap up or down before the open, so you need to find a good entry and complete the trade with a few hours and before the market close.
definietly not for the inexperienced, but can be good practice if using some small positions.
|
|
Registered User
Joined: 2/5/2006
Posts: 1,148
|
.....and maybe SAR by itself simply isn't designed to give accurate buy and sell signals.
|
|
Registered User
Joined: 2/5/2006
Posts: 1,148
|
been an awful lot of intraday activity lately. i hope you're watching.
|
|
Registered User
Joined: 2/5/2006
Posts: 1,148
|
http://stockcharts.com/h-sc/ui?s=QQQ&p=10&yr=0&mn=0&dy=10&id=p36686604203&a=252699523
|
|
|
Guest-1 |