Registered User
Joined: 1/16/2011
Posts: 34
|
I just wanted to know what everyone uses for looking at stocks for the most part, and why
|
|
Registered User
Joined: 2/21/2007
Posts: 797
|
BLINDFOLD
|
|
Registered User
Joined: 1/16/2011
Posts: 34
|
hahaha
|
|
Registered User
Joined: 2/7/2005
Posts: 1
|
I prefer Candlesticks for short timeframes daily/intraday and OHLC or just HLC for Weekly and longer. A well respected trader Alexander Elder has pointed out on numerous occasions that candlesticks take up screen real estate. Just using the OHLC bars enables you to view more price history than if it was charted as candlesticks.
Interested to hear what others have to say. It is also cool to look back at the webinar archive and see what the pro's are using.
|
|
Registered User
Joined: 12/2/2004
Posts: 1,775
|
QUOTE (Saintcaffeine) A well respected trader Alexander Elder has pointed out on numerous occasions that candlesticks take up screen real estate. Just using the OHLC bars enables you to view more price history than if it was charted as candlesticks.
Telechart does not take up more historical screen real estate when using candlesticks. Aside from that, I can't imagine why any trader would not use candles. Old pros who use bars over candles probably started out using them before charting programs such as TC made then more streamlined and/or before they became more mainstream. Candles flat out tell the story of price contained within much more intuitively and faster imo. Imagine looking at a month long consolidation with more than usual amount of solid black candles screaming bearish...no way imo that important analysis would pop instantly to the eye with bars. the same info is shown with bars, but it definitely takes more time to discern. When flipping charts I want speed. I guess to a longish term investor bar vs. candle would not matter too much, but a trader of almost any holding period is another story.
|
|
Registered User
Joined: 1/28/2005
Posts: 6,049
|
Got rid of the seeing eye dog?
(what was his name, Harami?) 
I use bars just because that’s what was around when I started.
In spite of what the literature says (800 year rice traders)
candles are relatively new.
Thanks
diceman
|
|

Registered User
Joined: 6/6/2005
Posts: 1,157
|
I flip flop around between the two. Probably 50/50. I have no idea why. I have noticed no improvement using one over the other.
David John Hall
|
|
Registered User
Joined: 12/2/2004
Posts: 1,775
|
QUOTE (diceman) I use bars just because that’s what was around when I started.
In spite of what the literature says (800 year rice traders)
candles are relatively new.
Thanks
diceman
I guess it's what a trader was weaned on when starting out and the eye probably gets trained to see the info in the bar as quickly as candles, didn't mean to come across as an arrogant uppidity candlestick user:)
There are definitely some seasoned pros around who stick to the bars...Harry Boxer, William O'Neil, a few others featured in Worden Webinars.
|
|
Registered User
Joined: 1/16/2011
Posts: 34
|
Thanks for the discussion, I started reading as tech analysis textbook that points out that candlestick patterns, or at least some of them are not as statistically accurate as other methods, but I like picking out formations and have found them more useful to discern patterns as well.
|
|
Registered User
Joined: 11/1/2005
Posts: 240
|
I find using bars, price spread with volume and the closing more of interest than candles. the only class on candles I went to I found the names funny and was ask to allow others to see which they liked. candles confuse the real market, Price and Volume.
|
|
Registered User
Joined: 12/31/2005
Posts: 2,499
|
I have suggested to WB providing an additional piece of information. The tilt. This could be added to either candlestick or OHLC.
The would indicate if the H followed the L or vice versa
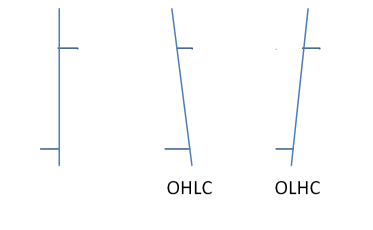
Either candlestick or OHLC lines work for me.
|
|
Registered User
Joined: 1/28/2005
Posts: 6,049
|
QUOTE (jas0501) I have suggested to WB providing an additional piece of information. The tilt. This could be added to either candlestick or OHLC.
The would indicate if the H followed the L or vice versa
Either candlestick or OHLC lines work for me.
Than computers would require bubble levels.
By the way, if you use your laptop in a sports bar,
you can have your candlesticks and "bar" at the same time. 
Thanks
diceman
|
|
Registered User
Joined: 12/31/2005
Posts: 2,499
|
QUOTE (diceman) [
...
...
Than computers would require bubble levels.
By the way, if you use your laptop in a sports bar,
you can have your candlesticks and "bar" at the same time.
Thanks
diceman
diceman
That candlestick joke was wicked.
|
|
Registered User
Joined: 2/21/2007
Posts: 797
|
Try line charts when looking at longer time frames. Sup & res. lines and channel lines draw nicely.
Waiting with great anticipation for diceman's humorous response.
|
|
Registered User
Joined: 1/28/2005
Posts: 6,049
|
QUOTE (johnlc) Try line charts when looking at longer time frames. Sup & res. lines and channel lines draw nicely.
Waiting with great anticipation for diceman's humorous response.
Bar charts are line charts, they have little lines going up and down, and little lines going sideways.
(lets not throw the abandon baby out with the bath water)
(well, little lines except when theres a flash crash)
Thanks
diceman
|
|
Registered User
Joined: 2/21/2007
Posts: 797
|
Bar charts are line charts, they have little lines going up and down, and little lines going sideways.
diceman
[/QUOTE]
Always putting doo doo in the ball game. Thank you for your rendition of what line charts are. Sometimes they may have long lines going up also, but only after selling. The little sideways lines seem to stay the same length. Never could figure out that.
Throw out the bath water? You don't recycle?
|
|
Registered User
Joined: 1/28/2005
Posts: 6,049
|
QUOTE (johnlc) You don't recycle?
Only my jokes.
Thanks
diceman
|
|
Registered User
Joined: 2/21/2007
Posts: 797
|
[Only my jokes.
Thanks
diceman[/QUOTE]
I'll try to remember that. I thought that just all of them were bad. Maybe I've been reading the same ones over and over.
|
|
|
Guest-1 |