
Registered User
Joined: 4/18/2005
Posts: 4,090
|
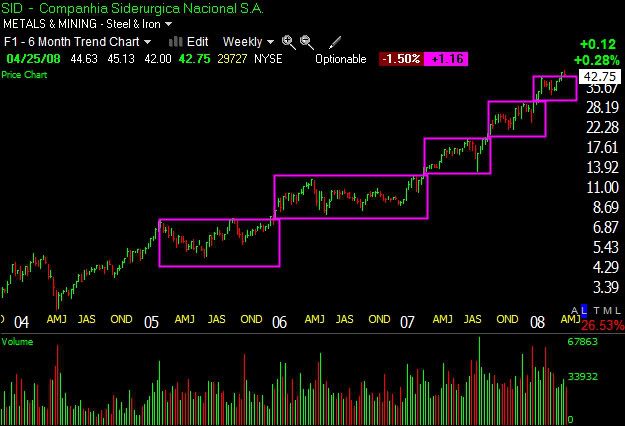
Just though I'd bring this one up... been watchign it for a while. Got filled the other day have a pyramid order floating just above price now.
|
|

Registered User
Joined: 3/21/2006
Posts: 4,308
|
Scott, This has a nice Bonanza Bottom forming here. I have re-designed my Bonanza Bottom Templates and I am finding that some nice bottoms are being formed right now. I believe now that we were not witness to a Bear market but just a very deeply carved correction.
I will put this on my growing list of Bonanza Bottoms to watch. Thanks for showing it.
|
|
Registered User
Joined: 4/18/2005
Posts: 4,090
|
Reminds me of a section in Nicholas Darvas's book. Where he says that his system kept him out of a bad market altogeather (how exactly he dosen't get into) and that at the time everyone was calling it a bear later when it recovered (quite spectacularily) he says in retrospect the talking heads at the time would call it "an intermediate term correction" ..... but all agreed that prices colapsed.
I saw you were doing something with the Bonanza Bottom templates in the Support section  . .
These things for me are alwase tough to tell till way after the fact. The Moneystream and other leading divergences is I think Telling BUT the indexes look a bit bear flaggish. I stick to the thinking that we have a short term bottom if not in then nearly in.
I don't think the stock market and the economy are the same thing... affected by each other possibly but not the same thing. If anything I think the stockmarket leads the economy.
Reguarding ELOS I now I don't have a complete higher high and higher low but this tight low base here is a nice risk / reward and with that gap above I took it here.
|
|
Registered User
Joined: 3/21/2006
Posts: 4,308
|
Scott, you should look at LRY & PIR Two good Bonanza Bottoms.
|
|
Registered User
Joined: 12/2/2004
Posts: 1,775
|
[QUOTE=scottnlena]Reminds me of a section in Nicholas Darvas's book. Where he says that his system kept him out of a bad market altogeather (how exactly he dosen't get into)
Scott, Darvas stayed out of trouble in a bear market because he had discipline with his stop loss points; his intitial tight stop on first entry of partial size to minimize losses, and later his loosened stop as he moved it up to preserve gains. Also he only bought strong basing stocks moving up into new high territory, and those type setups rarely presented themselves in a bear market. His system therefore gradually and automatically placed his equity heavy into cash as a bear market evolved. I'm a very big fan of Darvas's method because of its simplicity and also because his method preceded IBD's William O'Neil's whose CANSLIM system today has strong similarities to Darvas's. My current method is a heavy blend of Darvas and O'Neil, so any time I see a post mentioning Darvas and/or O'neil/IBD, I'm gonna give two cents on the subject:)
|
|
Registered User
Joined: 3/21/2006
Posts: 4,308
|
Fpetry, thank you for your un-witting inspiration. I googled Darvas and was able to read the first four chapters of his book. I already knew a little about his box theory and wondered if it might still apply today so I designed an easy scan based on volume and price and got about 2,000 charts I was flipping through them at about two per second and there they were - Boxes
He said that if price would drop below the box he would discard the chart and if price broke up through the box then he would buy them. I looked at quite a few past boxes that worked perfect to the up-side. I am going to study this further. Also why not swing trade within the box for some short term action while you are waiting for the break-out.
Take a look at ABAT price is at the bottom of the box and starting to turn back upI think that I will buy it on Monday. He also said that Volume plays a big role in the departure of price from the limits of the box. Notice my chart right as price broke free from the first box the Volume just took off. I am busy with my short term VSA and Bounce trading right now but I will find the time to study this stuff as well. Again thanks for turning me onto this stuff..
Apsll.

|
|
Registered User
Joined: 4/18/2005
Posts: 4,090
|
QUOTE (fpetry)
[QUOTE=scottnlena]Reminds me of a section in Nicholas Darvas's book. Where he says that his system kept him out of a bad market altogeather (how exactly he dosen't get into)
Scott, Darvas stayed out of trouble in a bear market because he had discipline with his stop loss points; his intitial tight stop on first entry of partial size to minimize losses, and later his loosened stop as he moved it up to preserve gains. Also he only bought strong basing stocks moving up into new high territory, and those type setups rarely presented themselves in a bear market. His system therefore gradually and automatically placed his equity heavy into cash as a bear market evolved. I'm a very big fan of Darvas's method because of its simplicity and also because his method preceded IBD's William O'Neil's whose CANSLIM system today has strong similarities to Darvas's. My current method is a heavy blend of Darvas and O'Neil, so any time I see a post mentioning Darvas and/or O'neil/IBD, I'm gonna give two cents on the subject:)
I'm a fan of Darvas also .. his money management i'm not a fan of. When I say that it's not clear just how he totaly sidestepped the bear market what I mean is that generaly there are SOME stocks forming his stacked boxes even ina bear market.. yet he was going to cash. Also you say that he scaled in but buying 500 then 1500 and 1500 isn't really scaleing in. Pluss he got really lucky. A couple splits and that over the counter mark up deal.....
I am aware of his methods and consider using them for a longer time frame hold type of strategy.
|
|
Registered User
Joined: 4/18/2005
Posts: 4,090
|
He also was accused of cooking his books for the book "how I made 2 million" and settled out of court and agreed to never get in volved in any U.S. financial markets. the details of the proceedings are unclear or loast.. but it is clear that he did make 2 million on his books.
also he wrote "Wall Street, the Other Las Vegas" and another one... most of his books got him despised on walstreet.
|
|
Registered User
Joined: 12/2/2004
Posts: 1,775
|
Apsll, glad that you're interested in the Darvas method, and hopefully more so for O'Neil because in his books and writings he goes into much, much more detail and gives quite specific rules/guidelines. In the chart for ABAT the box on the right would not be a box that Darvas would consider, or O'Neil, for several reasons. Darvas's method called for entering a position on new all time highs. O'Neil says it's okay to enter "near" a new high of about 2 years plus. Other factors too, such as low liquidity, single digit, poor fundamentals, high percentage pullback from Oct. highs, etc. But for example sake, assuming both men had owned the stock months earler, both of their methods imo would have triggered total liquidation of the postion on 11/16.
Scott, I think Darvas was lucky too in that he sometimes would have his entire balance in just a couple of stocks. That's just too risky for any trader, especially since he was not a daytrader. As for going heavy cash and avoiding bear markets, I think you need to look at his overall method. If it was any thing like O'Neil's is today (and O'Neil lists Darvas as having strongly influenced his current IBD method), it was simply highly unlikely that he would buy any long postion in a confirmed bear market. I like to use O'Neil's teachings because he's still current, and O'Neil might nibble at a long in a bear market, but would stay mostly cash. So I can only assume that Darvas used a similar strategy during market drawdowns if not outright bear. But in Darvas's book he made all that big money in a roaring bull market of 1958 and 1959. So more luck for Darvas picking that time period to start his foray into stock investing.
Back to scaling in a stock, any time you divide your position into at least two buys, that's scaling in. Darvas would nibble with a very small percentage on first buy, then follow with two larger but equal sizes in the example you gave. There are successful traders today who take a very small intitial position size...their method is to force them to watch a stock like an eagle, which one is forced to do when you actually own it regardless of stake, then if it moves in favored direction they add significantly more before it gets too extended. I'm pretty sure that was Darvas's method. O'Neil takes a different tact, he likes for first buy to be about half size or 50%, the second buy at about 30%, final third buy at 20%, but those are just general guidelines he offers. My method calls for equal thirds, but sometimes it will be two equals, or 5 pieces of varying percentages. All depends on how fast price moves, how close initial entry is to intitial stop level, volatility of specific stock, etc. Sorry to get longwinded but I do enjoy chatting about these methods.
|
|
Registered User
Joined: 12/19/2004
Posts: 415
|
I did the Google search, but I don't understand how the system works. The back and forth ighs to lows and today's values vs yesterday's value. Any simple explanation of this method?
|
|
Registered User
Joined: 4/18/2005
Posts: 4,090
|
QUOTE (bknight) I did the Google search, but I don't understand how the system works. The back and forth ighs to lows and today's values vs yesterday's value. Any simple explanation of this method?
It's just his mental method for settign the box highs and lows. There is a site with a state machine that you can flow through.. Or david John Hall pointed me to one that plotts boxes for you.
OR you could simply plot Donchian chanels on price.
MAXH8 (or what ever period)
MINL8 (or what ever period)
once his other criteria are met a purchase is a breech of the upper chanel... ON the breech. He used buy stops to enter his stocks.
|
|
Registered User
Joined: 4/18/2005
Posts: 4,090
|
QUOTE (fpetry) Apsll, glad that you're interested in the Darvas method, and hopefully more so for O'Neil because in his books and writings he goes into much, much more detail and gives quite specific rules/guidelines. In the chart for ABAT the box on the right would not be a box that Darvas would consider, or O'Neil, for several reasons. Darvas's method called for entering a position on new all time highs. O'Neil says it's okay to enter "near" a new high of about 2 years plus. Other factors too, such as low liquidity, single digit, poor fundamentals, high percentage pullback from Oct. highs, etc. But for example sake, assuming both men had owned the stock months earler, both of their methods imo would have triggered total liquidation of the postion on 11/16.
Scott, I think Darvas was lucky too in that he sometimes would have his entire balance in just a couple of stocks. That's just too risky for any trader, especially since he was not a daytrader. As for going heavy cash and avoiding bear markets, I think you need to look at his overall method. If it was any thing like O'Neil's is today (and O'Neil lists Darvas as having strongly influenced his current IBD method), it was simply highly unlikely that he would buy any long postion in a confirmed bear market. I like to use O'Neil's teachings because he's still current, and O'Neil might nibble at a long in a bear market, but would stay mostly cash. So I can only assume that Darvas used a similar strategy during market drawdowns if not outright bear. But in Darvas's book he made all that big money in a roaring bull market of 1958 and 1959. So more luck for Darvas picking that time period to start his foray into stock investing.
Back to scaling in a stock, any time you divide your position into at least two buys, that's scaling in. Darvas would nibble with a very small percentage on first buy, then follow with two larger but equal sizes in the example you gave. There are successful traders today who take a very small intitial position size...their method is to force them to watch a stock like an eagle, which one is forced to do when you actually own it regardless of stake, then if it moves in favored direction they add significantly more before it gets too extended. I'm pretty sure that was Darvas's method. O'Neil takes a different tact, he likes for first buy to be about half size or 50%, the second buy at about 30%, final third buy at 20%, but those are just general guidelines he offers. My method calls for equal thirds, but sometimes it will be two equals, or 5 pieces of varying percentages. All depends on how fast price moves, how close initial entry is to intitial stop level, volatility of specific stock, etc. Sorry to get longwinded but I do enjoy chatting about these methods.
I like the O'niel method for scaleing in.. the reason I like it is that generaly your last purchase will be the looser.. o making each position less than the previous or equal to only makes the previous purchase a looser. With out a roaring bullmarket buying 50 then 1500 and then gettign stopped out makes a net looser. but uyting 1500 then 1000 then 600 and so on.. keeps more proffits. If price is going to get up there it will go there.. but if not no reason sink with the boat.
I keep coming across the O'Neil methods. I HATE fundamentals..... prefer to do as much as possible with charts. I consider paying for the IBD service just becasue I'd rather pay for a list of proven fundamentaly goos entities that I don't need to do it on.
I have the Darvas book and I wasn't to clear on his other criteia. I should re read it probably. The boxes are easy enough... it's just a breakout... but it's the other criterion that i'm fuzzy on.
|
|

Registered User
Joined: 6/6/2005
Posts: 1,157
|
hey fperty,
I'm with you -- I think Darvas is well worth reading and studying over and over. And then some more. I have read his book several times and am currently reading it again. Each time I learn something more about his aproach and his wisdom. I am of the mindset that Wall street questioned the validity of his approach for the simple reason that it was in their best interest to do so.
Regarding his position size, I am of the minority belief that there was nothing wrong with his position size. As we concluded in another thread on system trading and money management, when placing a trade you are not risking the entire position. You are risking the portion of the position that would be affected by a catastrophic event. Darvas was well known for his use of stop-loss orders. True, they would not have saved him if he were in a company that went bankrupt or suffered a one day loss like the recent BSC fiasco. But Darvas was also known to study the fundamentals of his companies quite closely. Hence, his final techno-fundamental approach. So, for his initial position, he's looking at a 10% loss on a 50% position. This obviously met his risk tollerance and goals nicely.
I think one of Darvas's major accomplishments was his ability to finaly remove his emotions from his trading and while reading the book I get a sense that this was his biggest acheivement. I have just read again the part where Darvas talks about his final ability to let his profits run and not close after a few percent gain.
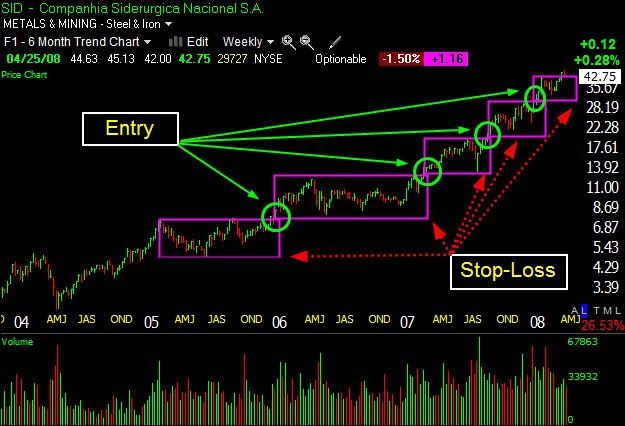
His plan was well developed and befitting of his personality and came about after years of very hard work and study. On this reading I also noticed one thing that i had missed on other readings, and that is Darvas's close study of a stock's character. That he prefered "matronly" stocks that suddenly changed character. He would then study these stocks and see which boxes they were trading in. He would watch these stocks as new boxes were formed and would let the stocks determine the size of these boxes. Then, when he was confidant that he had found a stock matching his criteria, he would buy the break from one box to another and use the floor of that box as his stop. If the stock rose to another box he would increase his position and continue doing so until the stock fell to a lower box at which time he would close his position. And if he was wrong about closing the position he would have no qualms about buying back in on higher prices.
I am of the firm belief that the harder you work the luckier you get and believe that Mr. Darvas worked very hard and showed smaller, retail traders a pathway to success, and thankfully documented his approach. More than anything, I think his book is a call to find your own system, your own path in the market, and stick to it and revise continually until you have one that works for you.
Another important part of the equation is the frequency (or lack of) which Darvas was able to monitor the markets. With his dancing schedule occupying much of his time he only had available a weekly copy of Barrons whcih he would pour over religiously and look for price/volume activity that caught his eye (notice no charts). this kept him out of the day to day swings that could have affected his decision making process. This proved to be a major factor as his trading deteriorated when he was able to take an office within earshot of Wall Street. And his success returned when he left.
Also, the more that I read Darvas I understand that although his trading was mechanical, his stock selection was far from it. He looked for certain criteria to be in place and a certain price/volume activity, but he had a very hands on approach to watching and monitoring and deciding when to enter.
Anyway, thanks for the great discussion. Below is a chart that i would conside a great Darvas example.
David John Hall
|
|
Registered User
Joined: 12/19/2004
Posts: 415
|
QUOTE (scottnlena) QUOTE (bknight) I did the Google search, but I don't understand how the system works. The back and forth ighs to lows and today's values vs yesterday's value. Any simple explanation of this method?
It's just his mental method for settign the box highs and lows. There is a site with a state machine that you can flow through.. Or david John Hall pointed me to one that plotts boxes for you.
OR you could simply plot Donchian chanels on price.
MAXH8 (or what ever period)
MINL8 (or what ever period)
once his other criteria are met a purchase is a breech of the upper chanel... ON the breech. He used buy stops to enter his stocks.
I'm blind I guess, checked all the sites listed and the only ones where were paid sites and or software purchases. But thanks for the hint on the Donchian chnnels
|
|
Registered User
Joined: 4/25/2007
Posts: 91
|
Fpetry: I am trying to catch up on ONeil's writings and have read initial boook on CANSLIM. Could you please make your recommendation on his books which you like? Thanks, Jayrama
|
|
Registered User
Joined: 4/18/2005
Posts: 4,090
|
I wish there were box drawing capacities as well as trend lines in TC.. The best thing will be to draw them with trend lines.. but the Donchian chanels will help to start to get the visualization process down.
I may have been a bit short in my Settings above. Just glanced at my darvas book and looked fo the number of daily High Low Quotes it took him to define his boxes... but they do obviously vary.
Maybee 15 period or 20 period.
|
|
Registered User
Joined: 12/2/2004
Posts: 1,775
|
DavidJohnHall, nice post and thanks for the chart graphics, good job.
bknight, I think you were asking above how Darvas's boxes were plotted. He used daily price bars (mentally or written down usually) and once a new high was made (after breaking out of previous base) he would use the new high as the upper limit of the new box if that new high held for 3 consecutive trading days, and vice versa for lows of the box. As an example, if first day low price in a new box was 20, but two days later price made a low of 19.50, then 19.50 would be the new box low ONLY IF three more consecutive days passed and the 19.50 low held. Later on if price dropped to 19.40 Darvas would stop out.
jayrama, O'Neils main book is "How to Make Money in Stocks." It's the only book of his I've read, but it's the hot one and has been for a few years.
Back to Darvas's box method. It's really very simple...all of his boxes are simple lateral consolidation patterns. O'Neil in his CANSLIM method calls his boxes cup/handles, flat bases, double bottoms. One of the main differences between O'Neil's and Darvas's method is that Darvas would consider a breakout of say a ten day base as legit, while O'Neil's method requires significantly longer bases of several weeks (minimum 5 weeks for a flat base, 7 weeks for a cup/handle or double bottom. Also, whereas Darvas might add to a position after price moved up out of a box 10%+ from original entry, O'Neil teaches to add to a position not more than 5% above initial entry or breakout price. The big picture when comparing O'Neil to Darvas is that both of their methods buy stocks coming out of bases from an ongoing uptrend, and approaching or making new all time or 2 year highs...Darvas would only enter a new postion if it was making new all time highs.
|
|
Registered User
Joined: 3/21/2006
Posts: 4,308
|
Fpetry, I agree with you that both Darvas' & O'Neils methods are successfull for them, I find that my learning curv is very similar to what Darvas' wrote about in his book, in that he studied price action and Volume. He proved early on that Fundimentals are not what drives a stocks price (unlike O'Neil which for him fundimentals are at the center of his theories). To me the boxes are nothing more than consolidation levels, usually giving price a chance to rest at a previouse resistance before moveing foword or down to the next level or box. I have been looking at many many charts, and find that you do not need to be making new two or even one year highs to use the box theory. Also remember that Darvas' did not make his fortune until the start of a strong Bull market. His studies of the market back then are no more valid than mine. He found a system that worked for him and was the benificiary of buying into some emerging technology stocks at the time. Putting stops below the box is a good way to protect yourself. He just worked real hard at analizing price action vs Volume, and actually took on to much risk by putting all his eggs into to few baskets. I guess that Bigblock is right you do get paid to take on risk. With my success rate the last four to five years if I took the kind of risk that he did than I to would be a multi-millionaire by now, seriously.
Do not get me wrong Fpetry He came up with a good sytem, but I believe that you can change his rules and still make the box strategy work. I am going to try anyway. Below is a chart that is not a-typical of other charts that I have seen many times.
Any way again thanks for steering me in this direction.
Apsll.

|
|
Registered User
Joined: 4/18/2005
Posts: 4,090
|
I think the most beneficial aspect of teh box system is that they provide a clear context in which to manage a trade. When to buy, when to add more, and when to sell.
I didn't understand what he meant by "matronly" stocks. David John Halls Quote. To me the system in The darvas book wasn't really clear.. I got this sort of "magical mystical" sensation as he describes his development of the system and which stocks he's selecting. Or it's simply looking for stocks that seem to be rising. If there was some momentum trend line elemant or fundamental feature that was key I must have missed it.
Unless he still adhered to the fundamental sturctureing in his "first Crisis" chapter... AND looking for stocks to be going up.
I need to re read it but I definatly felt like it was basicaly look for stocks that seem to be rising .. and define the boxes. Enter on the push into a new box and sell the drop out of the box. IN some cases the stop order goes at the high of the previous box.... which may not necessarily be the current box low.
|
|
Registered User
Joined: 6/6/2005
Posts: 1,157
|
Hey Scott,
By matronly stocks I was refering to the part in the book where Darvas looks for stocks that change character. He says that when a tempestuous beauty stands on a table in a bar and dances no one takes notice -- but if a matronly woman were to do the same thing it would definitely be out of character and worth noting.
Darvas was looking at stocks at all time highs. Breaking into new highs. On very strong volume. In forward looking industries. If he was correct on a small initial buy he would add striongly to his position until the box floor was violated. this differs from Oneil as oneil suggests taking money off the table as the trade rises.
David John Hall
|
|
Registered User
Joined: 4/18/2005
Posts: 4,090
|
I must have either missed or forgotten about the all time highs part. The foreward looking industries is a bit harder ... for example I thought Nano Technology would be where the hot action would be for a while.. Ha! LOL.
I've been pretty wrapped up in monitoring this 10 day low reversal thing. Oh I got the actual Turtle soup rules. They are EXACTLY the opposite of the Turtle entries.
Hope all has been well with you. Oh ALL the inverse ETF's for the indexes have come through the reversal scan in the last two days. As well as Gold, the comodity index ETF and some oil. Should be interesting to see how it plays out. So far during this sidewayse chop there has been a fluxuating higher range of numbers in the scan returned nightly. During the previous leg up numbers were fairly low.
I'm thinking and so far it look like this may be the case, that it will help me with my timing. i wanna watch another complete market swing with it. BUT I've traded some of it's signals so long as there were items on my nightly check list for other reasons and just happened to give that signal as well. I think I'll have it ready to trade soon.
I wanna get into optimal position sizing for it and money management parameters/options soon. did some "Elder style Fwd Testing" and more than doubled my account in less than 1/2 the amount of trades I had last year. Still amazes me how that happens when Foreward testing like that.. not woryign about Fed anouncements, earnings, any of that.. Just reading the chart from bar to bar I can often clean up. Except on Inspected .com. Either you get to pick a set time frame and waht happens happens or you can go day by day but a big range up day tracks as a loss to your long position ! ? So if i'm gonna play market games I'll get out telechart and an excel sheet.
|
|
Registered User
Joined: 6/6/2005
Posts: 1,157
|
Hey scott -- are my emails coming through?
|
|
Registered User
Joined: 4/18/2005
Posts: 4,090
|
Actually not.. I sent a few as well and figured I belabored the point of the 10 day reversal . I recently upgraded to IE7 but I don't think that would have anythign to do with it. You're in my adress book.
|
|
Registered User
Joined: 6/6/2005
Posts: 1,157
|
Interesting, I sent several over the last few days and then got an email from you asking where I've been. lol And I'm not sure it's possible to belabor the subject of trading and making money. :)
|
|
Registered User
Joined: 4/18/2005
Posts: 4,090
|
"And I'm not sure it's possible to belabor the subject of trading and making money. :) "
My wife would beg to differ..  i'll check my bulk mail. i'll check my bulk mail.
DUG was a minl10 trade. I've taken a few now.. most were proffitable.
Have had the lucky experience of putting a smiley in my exit notes after the "Stopped out" comment on closing a trade.
I really was ok with it.. no anger, dissapointment or any of that. I think that my intutitve edges may couple well with the MINL10 strategy. One BIG thing is to move the stop to breakeaven pluss a tad when it is realisticaly possible.. or wait 4 days before touching it. so far stop and reverses seem not to really be necessary. I still cut allot of them to short.
Sold PNRA 2 days ago.
|
|
|
Guest-1 |