
Registered User
Joined: 6/6/2005
Posts: 1,157
|
Hi everyone...as I am studying these monster stocks, and after trading ESLR unsuccessfully last week, I am noticing something that pops up time and time again. I have always been aware of it, and there are quite a few sites that discuss it on the web, but I'm hoping there can be some type of remedy... I'm talking about the breakout fakeouts and breakdown shakeouts that occur in these big movers.
In my opinion this could wreak havoc on your nerves. I've read that many times the big players fake out the dumb money into the worst positions so they can shake them out a few days later and make money on the difference and aquire more shares before the real breakout begins. My question is, where is the real breakout. They say entry is the least important aspect of your system. I am not sure that makes sense to me. Yes, money managemnet is paramount. Yes, risk control, position sizing, and stop-loss placement matter, but if i don't get in at the right price I will be stopped out at the wrong price and I will be paniced the whole time.
Here's a chart of recent big mover ASTI:
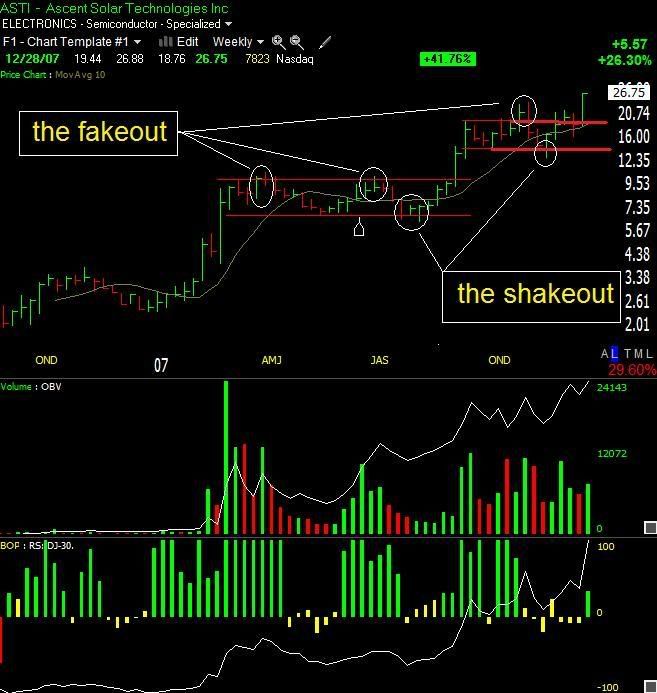
We've got decent buying the whole time,,,and we've got strong upward movement and on 3 different occasions price is taken up past the breakout point and pulled down to a shakeout point and then back up. Now, you might look at that and think -- wider stops...but in the channel box there's a movement of 30%. I have to admit that that's enough to freak me out. You might think take it to the daily chart...but on the daily chart the whipsaws just look worse. You might then say...some stocks just aren't that simple to board and ride...and after looking at a lot of them I would have to agree...
Does it come down to blind luck? I am wondering. If anyone can take the above chart with a diffferent perspective, by all means. The breakout shakeout is making me freakout! :)
David John Hall
|
|
Registered User
Joined: 1/28/2005
Posts: 6,049
|
It would all depend on how you want to trade this and hold it.
This isn't a very "trendy" stock. it kind of moves in a stair
step fashion. Flat/up strong/flat again.
(at least on the weekly)
I like to usually take note of the first low that breaks above the
28 Week moving average.
There was not enough data to create an exp version so I
used simple. I got a buy in the 9/12/07 zone. which would just
about coincide with the breakout of the 4/20/07 top.
The high of the bar was 11.34. Since it is 26.75 now it seems like
money should have been made.
Thanks
diceman
|
|
Registered User
Joined: 10/7/2004
Posts: 426
|
David, since I discovered the secret to reading the markets several years ago and found it’s not about picking stocks, but reading them correctly to make sure you don't make a foolish decision. I discovered the strategy of picking the major low, picking the wave 1 and wave 2 and after a wave 2 corrective pattern comes the most profitable wave 3. It is the most successful trade I have found with a win ratio close to 70% and a reward to risk ratio of better than 3 to 1. This is my favorite pattern, as I like to pattern trade and you guessed it (indicators are not used in the pattern). I try not to concern myself about the fakeout - shakeout - breakout. That’s for other traders that like the challenge. I will stick to my easy carefree trading methodology.
|
|
Registered User
Joined: 6/6/2005
Posts: 1,157
|
Booker,
That sounds pretty exciting. Congratulations on finding your secret. When you discus the third wave -- are these Elliot wave terms. I have also studied Elliot and made several profitable trades using that style of trading.
However, I am now specifically trying to find the monsters and not get shaken out on the way in. Your 3rd wave entry sounds like it would be very beneficial for an entry. Do you use no stock selectioon criteria at all? Your post implies you look for any stock entering a third wave. To me that suggests that there is some type of filering process.
If it's not too much trouble, would you mind providing an example of a 3rd wave entry? Either by chart or symbol and date.
Thanks!
David John Hall
|
|
Registered User
Joined: 10/7/2004
Posts: 426
|
David,
Yes it is Elliot wave. I don't count the waves like he does but do use the method. I will try to put together a chart or example of this pattern when I have more time. Today is with the wife and tomorrow is football day. So I will work on this monday.
|
|
Registered User
Joined: 10/7/2004
Posts: 426
|
Oh, forgot to say. Yes I do use filtering. I like to use Worden's "Winning Stock Selection Simplified II" for my scans and choose well behaved stocks to seach for this pattern
|
|

Registered User
Joined: 4/18/2005
Posts: 4,090
|
I haven't read all the posts yet. but the "Shakeout" you have marked above is almost exactly what I called the "Fake and Bake" humorously. As far as this goes... at some point we need to decide if were going to trade something and mke an atempt at it.
Looking at the daily .. by mid july it's begining to look like a bit like a top.. except for the bop. However BOP dosent mean stocks go straight up... usually far from the case. BOP in my eyes is almost useless for the "Next Few Days" sort of projections USUALLY. So wither it's gettgin allot of bop at a top, which I've seen or we may be moving to a range, which given the already huge leg up and gap up is senseable because price gains need to be digested. So unless Junes low is significantly pierced then sidewayse is the best we can say ... BUT this is a good trend as it generaly means a continuation later. I find that often there is a fake out.. (on multiple time frames). By late august it looks (in hind sight) that the prior lows are going to hold. NOW These range bound swings are enough for me to try to play.
I notice a couple of things happening.. sorry AB it involvs indicators. Constraining your buying to the bottom 1/3 region of the presumed sidewayse range, also note the position of Williams % R or a fast STO. and your purchase is closer to support and putting less at risk. Though many would say for an intermediate hold 3-4 points is not bad.. infact Technitrader teaches it as the norm. If you're squeamish buy fewer shares.
If we bought somewhere around a break above the high of 8/22 or some prior high we should be sitting pretty as prior pullbacks were on low volume. Then in Sept. you see how Sto starts to float above the over sold line ? this can often be an indicator of momentum either present or coming. I've read that Stochastics tends to "Fail" in this way allot and spend mor time inthe over sold territory than it should for momentum runing stocks. It is however highly useful in these ranges... but perhaps a sell shouldn't be considerd till there is a clear breakdown of STO (which just helps us view price activity a bit differently).
Back to technitrader. They teach that the entry for this is a GTC stop limit range above the July or even the April high and you stop should go slightly below 7.10. That is really tough for me to do.. so IF I enter this way I prefer to put it somewhere around 9.20.
OR exit that first week of Sept and REENTER THE order slightly higher incase I do the the breakout but that way if it dosent break i'm not riding it back down.. However Ive discussed this before.. my ideal entry is on the rise up from august lows... Its got a low diceman reading, a low % R or fast sto reading and around 8/23,while not happenign onthe sme candle, you get TSV > 0 and MA > it's MA. Also TSV 18 is trending up with in it's BB13, chanell DESPITE the 8/16 activity. Incidentaly wilders RSI 15,15 made a higher low compared to the lowere low of price.
Then September gives us the breakout on good volume.. IN the past i've taken this and moved on .. but to the patient it's now a waiting game...and we get the low volume pullback. This is the rub because nothign exciting is hapening here and I think this is most often the case... Volume is not dancing naked across the screen singing "this is a winner right here". However 10/15 might be a reason to take notice... but looking a a slightly broader picture somewher around an 8-10 day new lower close and a shrinking range I'd say it's time to start thinking about trailing price with a 1-2-3-4- buy strategy particularily when we get the inside day and no new low.
But the fake and bake or shakeout what ever you want to call it is actually somethign that I think about as an "when i've got time" project i'll work on creatign a scan or something more concreate to define it and search for them. But by an large i'm making money with my joint signal apraoch and come across most of these any way so it's a matter of pattern recognition after i'm looking at the chart.
|
|

Registered User
Joined: 3/21/2006
Posts: 4,308
|
David what you are undertaking here is noble, I have spent over a year doing the same thing. I tried to give analogies in my last post but there is no way to tell how big a monster is going to get until it gets there. Stocks will follow the same path and then for some unkown reason will stray off the path. All you can do is pigyback on the ones that are still on the path, when they get off then so do you. Thats it (IMO) you will not find a secret code that will lead you to a sure monster. Just like in life a mad man serial killer is not born that way, they are shaped into a monster by their environment and how well they handle the speed-bumps of life.
Any way take a look at this chart for analysis purpose only. Notice in the pullbacks for number 1 & 2 the volume was low, and not convincing so you know when volume and price head north again then you jump aboard. Now starting with number 3 pullback the volume is heavy so to me that means that the smart money is starting to un-load to the dumb money that think this stock will reach Pluto by Feruary.
All just my observations..
Apsll. Happy New Year. See you all on Wednesday.

|
|
Registered User
Joined: 6/6/2005
Posts: 1,157
|
Thank you Scott and Apsll and everyone for their very informative and insightful posts. The more I look at these charts, and I am doing so non stop, the more I am noticing that there ARE a few things they have in common. Nice run ups before a consolidation base that lasts 3-6 months. Pullbacks on low volume. Recent new all time highs.
As you just mentioned, on the way down, look for heavier volume on pullbacks and what looks like sharper swings. Thanks again and happy new year to you too!
David John Hall
|
|
Registered User
Joined: 4/18/2005
Posts: 4,090
|
QUOTE (davidjohnhall) I am noticing that there ARE a few things they have in common. Nice run ups before a consolidation base that lasts 3-6 months. Pullbacks on low volume. Recent new all time highs.
David John Hall
There may be something there in that larger moves are able to come from larger bases. Ultimately Sector could be a big part of it aslo. I think Earnings will be a factor. If not on the stock you are looking at then on a sector buddie. i wonder for instance if after FSLR's meteoric gains many people weren't looking for other solar companies to zoom to the moon as well. I have a hard time believing that FSLR is worth what it's trading at.... but then worth is nothing more than percieved value. If all the bean counters were correct in their estimations of value then markets would not make these huge swings. So I know I for one began to keep an eye open of other solar companies that were poised to make possible big gains on FSLRS tail coats. ESLR I believe is not finished here.. but My rules require that I wait until my version of the diceman returns a lower value.
((ABS(XAVGC20 - XAVGC35) + ABS(XAVGC40 - XAVGC35) + ABS(XAVGC50 - XAVGC35)) / XAVGC35) * 100.
I think I mentioned that one of my wifes colegues is an economics professor and was talking at a holiday party about the growing steam behind the "Green Revolution" and that it's becoming vogue and PROFFITABLE for people to be concrned with the enviroment and renewable energies.
Consider DRYS and SRCL. These were not vogue sectors as far as i'm aware so in these cases they sort of snuk on by. However as I recall DRYS was well positioned to take advantage of a falling dollar (could be wrong about that) any way with DRYS i'm certain that again Earnings were a factor at least at some point.
|
|
 Gold Customer Gold Customer
Joined: 10/7/2004
Posts: 264
|
David,
You just described the problem with trading breakouts -- a very high failure rate. IMO a focus on price would prevent the fakeouts and shakeouts. We only know one thing at the breakout point -- demand for the stock was greater than supply causing the stock to move up. Unfortunately, we only know that after the fact. So start with the 1st quater breakout at about $5.74. Your 1st shakeout came at a low of $6.50. That was a time to look to buy based simply on the fact that you had the $5.74 support level below you. The second breakout occured about $11.34 n the 3rd qtr. Once again the shakeout came at a low of $13.17. Again, that was a time to look to buy rather than getting shaken out. Had you bot on some of the fake breakouts, selling at these shakeout points is exactly what loosing traders consitently do -- the sell into a level of support/demand. Good luck.
|
|
Registered User
Joined: 6/6/2005
Posts: 1,157
|
Thank you, Golfman25!
I am beginning to see, and reframe in my mind, regarding the nature of breakouts. I imagine the smart money has fun with these set ups all year long. I have a friend who worked for Bear Sterns who said the motto there was buy support, sell resistance. I suppose breakouts appeal to so many people because a buy point appears so apparent on a chart. But as we all know...easy does not translate so well into profit.
I think the key is to imagine myself one of the big boys looking to accumulate millions of shares...and how would I do it? Certainly not buy buying ever higher prices. i would do it quietly on diminishing prices (the low volume pullback). At somepoint other large traders will see what's going on and then it's a rush to accumulate pitting large trader against large trader and that pressure forces a genuine breakout. As price approaches resistance and possible breakout, volume can be monitored for institutional support.
Thank you so much for your input.
David John Hall
|
|
Registered User
Joined: 6/6/2005
Posts: 1,157
|
Looking at the same chart (from above) with an eye to buying on periods of below average volume creates several successful entry points. It's so obvious what's going on in retrospect....price runs up...breakout traders (uninformed money) piles in, then price fizzles down...weak hands become bored/scared...sell to the smart money who accumulate more shares...price runs back up and the uninformed money pile back in....price fizzles out again...fear grows...and they sell again as the institutions accumulate more...and it happens all the way up!
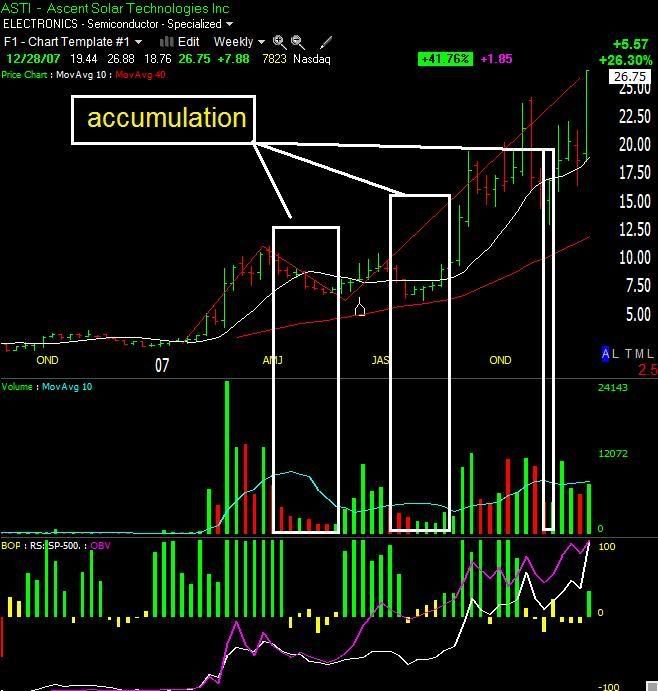
David John Hall
|
|
Registered User
Joined: 9/13/2006
Posts: 143
|
David:
I thought CMG be nice for your study as well.
Thanks for educational charts.Moe
|
|
Registered User
Joined: 4/18/2005
Posts: 4,090
|
QUOTE (davidjohnhall)
I think the key is to imagine myself one of the big boys looking to accumulate millions of shares...and how would I do it? Certainly not buy buying ever higher prices. i would do it quietly on diminishing prices (the low volume pullback). At somepoint other large traders will see what's going on and then it's a rush to accumulate pitting large trader against large trader and that pressure forces a genuine breakout. As price approaches resistance and possible breakout, volume can be monitored for institutional support.
David John Hall
This is why I think volume is so difficult to interpret.. OR not interpreted as classical thinking would suggest. I have often eoncidered looking for low volume in my scans verses looking for high volume.... but the good volume seems to work well enough anyway so i've been hesitant to fix what isn't broken.
Obviously you wan't to see good volume on the important moves..
|
|
Registered User
Joined: 4/18/2005
Posts: 4,090
|
HMMM a pcf for declining price, declining range, and declingin volue... could be worht playing with.
|
|
Registered User
Joined: 6/6/2005
Posts: 1,157
|
wow moakhavi,
Nice looking chart. I think I favor these types of charts most out of all the big movers. There seems to be a clear cut pattern and psychology to the moves and now with prior support as the buy point they seem to be making more sense to me.
Here's the chart. It's a really nice exampole. Thanks for pointing it out!
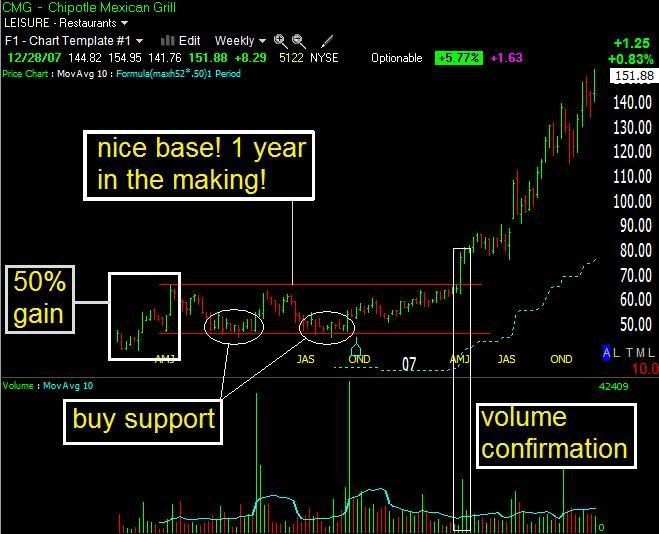
Ontop of that it's a great restaurant! :)
David John Hall
|
|
Registered User
Joined: 6/6/2005
Posts: 1,157
|
That sounds like a great idea as well Scott and one I could easily backtest. I agree you want to see volume on the important moves, but I am beginning to believe that you should be in the market already by then and using a price move on volume as confirmation.
Another way to look at it (and I'm just thinking out loud here) but imagine a stock has been accumulated by institutions in the base, and then breaks out. It could run up on low volume like CMG up there because there are no shares left to buy. Supply and demand. Demand exceeding supply and the fact that the institutions that hold those shares can start offering them for what they want as Retail traders chase them all the way up...only to get unloaded to at the top.
Just a thought.
David John Hall
|
|
Registered User
Joined: 9/13/2006
Posts: 143
|
Thank you for display of the chart .I am still struggling to put the cahrt up.
Moe
|
|
Registered User
Joined: 9/13/2006
Posts: 143
|
David
I just came across NILE
Looks consolidating for possible next leg up. What do you think of this for your research?
Thanks,Moe
|
|
Registered User
Joined: 4/18/2005
Posts: 4,090
|
Just thought I'd toss out a few consolidators for us to watch. Some aren't the cleanest... Others are consolidating on a weekly view. So far I think it's a decent cross section. Some have interesting divergences forming. I THINK my official stance is that I prefer consolidations or breakouts where prices is above the 35 Week EMA which should also be rising. But that dosen't mean that there aren't oportunities in other scenarios. I have at least one fallen angel pattern in here. Some may be low liquidity.
Actually I was reviewing the Weinstein book before taking it back today and one of his templates that seemed senseable in terms of searching for the setup was a 30 Week EMA of Price with Volume and RS of an Index. Candidates become hot items when a breakout pushes them above the Ma on high volume. If you'r in and the breakout dosen't clearly h ave good volume he suggests selling or really tightenign up stops. Then the low volume pullback to the support area of the moving average or the prior price resistance. RS sholuld be leading price as well but his version is a bit different. There is a whole chapter on finding and managing these monster stocks ... forgot about that.
here are the tickers.
AKAM
AWI
BCO
BER
CKH
DENN
DSTI
GAP
HR
IOTN
ISPH
JDO
LRT
MMC
PARL
PLM
RRD
RRI
RTN
SLE
stmp
|
|
Registered User
Joined: 4/18/2005
Posts: 4,090
|
David John Hall:
I don't know if you said you've read "Way of the Turtle" or not but i'm reading it and it's quite interesting. On the topic above of not being afraid to retrade the same issue several times Curtis faith explores a Cocoa transaction for the year 1998. Their system generated 17 losses in a row. Admittedly that would be enough for me to stop trading it and maybee swear off chocolate altogeather. Cumulative losses were 16,000. However staying consistant and trading the signals given the 18th trade brought in 24,940
then another loosing streak of 4 bad trades for a high about $1000 each in losses and another 20.5K proffitable trade and so on and so forth. The Year ended at $55K in proffits from Cocoa.
Curtis asserts that they were taught not to try to "Predict" anything, that human emotions are behind the bulk of the phenominal moves and you never really know where the next great trend will come from OR how far it will run so TAKE ALL SIGNALS.
naturaly this is easier in the futures markets when there are fewer issues to follow... In stocks there are thousands.. but I think you are specalizing now any way and I think that is probably the best thing.... Even just keeping a regularly checked watchlist of candidates that show the basic criteria you are looking for and check them EVERY DAY. AND TAKE THEIR SIGNALS. Strings of losses do not reflect poorly on the trader or the system if they are not allowed to affect the trader psychologicaly (good luck with that on 17 trades at -17K) as if the trader understands their edge they should be able to remain consistant in their trading knowing that over the long run they will come out ahead.
I'm getting the sense that their basic setups were verry similar however. And it's therefor a good idea to be hunting in the areas that have the probability of producing the sort of trends they want to catch. So that IMO should be the focus of our quest.
for me this means finding periods of longer low relative volitility or recent breakouts.... the rest is in trade management. Faith makes a big point of the fact that most traders get all wrapped up in trying to "Predict" and this is actually a detriment. Also letting recent strings of losses and bad performance affect your perception of your systems and abilities. He admits that there are times when their methodologies didn't work well and that what gave them their sucess had less to do with what, when and how they entered than how they handled what they had entered.
I know this is an issue for me. take YUM, BIOS and NANO. these were all proffitable trades for me. Yum I took the recent large range day and into the high of the next day. .. over the short term that trade worked out well. I'm anticipating another entry soon that may give me the breakout. BIOS and NANO I was also in early in the previous run ups, and happily proffitalbe.... but I sold in the first 25% of the run because I let market condition freak me out . . . . butter fingers. Looking back the sort of thing I prefer to catch is the nice trends of BIOS and NANO. However lately I've been taking proffits sooner than later and especially if I get the sort of large range day I got with YUM right off the bat. I THINK in this market it might be best to play them a little closer to the chest , so i'm not too fussed ... But I clearly dropped the ball on the other two. All three were proffitable so . . . . Looking back the sort of thing I prefer to catch is the nice trends of BIOS and NANO. However lately I've been taking proffits sooner than later and especially if I get the sort of large range day I got with YUM right off the bat. I THINK in this market it might be best to play them a little closer to the chest , so i'm not too fussed ... But I clearly dropped the ball on the other two. All three were proffitable so . . . .
|
|
Registered User
Joined: 6/6/2005
Posts: 1,157
|
Hey Scott,
That is very interesting as I experienced something very similar this year. At the beginning of the year I was trading a reversal system based on large downside gaps on heavy volume. Through my backtesting I had determined the 5th day after a big gap like that, when everything has settled, stocks that have gapped on panic will trend higher. It’s a great system on paper, and worked very well in 2006 and every year back to 1997, and along came the subprime collapse. Needless to say I bought some dogs on that one. Just when I had decided to back off that system, WCG came along. I laughed as it showed up in my watchlist and thanked my lucky stars I wasn’t going to have to buy another dog. I mean, it looked ugly! Well, it gained 75% over the next few days. Which is in line with what you’re talking about. There were a couple others I missed out on and all in all the system would have come out a little ahead for the year.
It did however; teach me that, even though you have a profitable system, it’s not enough. It has to be a profitable system that’s inline with your personality. Those downside GAPS can look nasty. And it worked on my nerves. Either I was going to learn how to be comfortable with them or I was going to have to find another system. And trust me, I have a chart book filled with hundreds of charts showing those reversals and how they work and where to put the stop and limited downside risk and average bounce, etc. etc. etc. Still…it’s scary down there!
Maybe it will be worth another look after the market has returned to normal (?) lol I’ll post some of the charts later.
But I agree with you about the 7,000 plus stocks. That’s why I liked this particular system: selection. On average you’ll get one or two stocks that GAP like that in a month. I knew something was up when I was getting 2 a day.
Now, with the 2 ETFs and a once a month quest for the runners – I’m a happy man! Oh, and I have read that book. There’s a good one called Trend Following written by Michael Covel – he also just finished a book about the turtles. He discusses many different trand following systems in that book which is supposed to be the definitive work on the subject…
David John Hall
|
|
Registered User
Joined: 4/18/2005
Posts: 4,090
|
just got into the next chapter and he's talking about the Dochian Chanels and trading them as breakouts AND he ADMITS that for short term traders it's best to fade the breakouts because so many fail. BUT when they don't.... lookout!In a way it makes a sort of logical sense.... though to be honest i'm confused on what's "logical" in the market any more. but selling high and buying low, selling strength and buying weakness. pluss there are so many pullbacks after the breakout..... it could be fun to fade them and then catch the reversals with a stop and reverse order.how to scan for them ? ?I wanna reak Tharps next and this "Trend Following" sounds good. Oh aparently Faith is in the market testing software business. spends allot of time talking about quantifying your "Edge" over the market.
|
|

Registered User
Joined: 10/7/2004
Posts: 2,181
|
David;
Worden notes for tonight speak very directly to your quest for the monster stocks.
I hope to stay in the loop on this one. At the same time, I intend to be riding my Rolling Stones as they bounce down the hills. A down market is one of the prime times for "the tobydad profile" (he said euphemistically). A couple of slight modifications and it picks up those hops as the stone is rolling down the steep slopes.
If I can keep picking up my 5-7% monthlys with the Rolling Stones and Against the Grains and then ride along on your monster stocks, it should be a good year, up or down market.
Happy New Year to all!
|
|
Registered User
Joined: 4/18/2005
Posts: 4,090
|
It's not the cleanest example but it could be a good example. If you look at ILMN on a zoomed out view we've had a break above 58.60 on ok volume and a slight pullbackto the support area on low volume. Now there is resistance from the October high BUT I've seen this before when a stock consolidated near a previous all time high. Often they will step back a bit first. OR it's working on a daouble top BUT it's been fairly resiliant in the recent market and no 10/24 I have a note that it was 2X upgraded. I traded it November and in December recently.
|
|
Registered User
Joined: 4/18/2005
Posts: 4,090
|
Just finished "Way of the Turtle" and was a bit dissapointed. Curtis faith is hailed as the most sucessfull of the turtles... BUT he hasn't really gone on to do anything incredible as far as trading. He made Millions while trading for Richards but aparently after that money was gone.. much squandered on failed business ventures he had to "Get a Job". He aparently did make a foray into trading and didn't do so hot at it. What was the difference? There is another tutrle that has made billions trading since then.
Back the to Turtle thing:
People say that the methods don't work now that so many people want to trade them. But Richards him self is quoted as saying his strategy could be printed in the newspaper and it wou'ld not affect anything on his end BECAUSE the Turtle brekout methodology accepts that more than 1/2 their trades will be loosers, and is subject to considerable drawdowns. Two things that work on a traders psyche so that they become their own worst enemy. In the end he felt that most traders wouldn't have the discipline to stick to the program and there for the program would probably ruin them.
Faith says that MOST breakouts failed .. not now.. but then .. in the turtle days. That shorter term traders would do better to trade against breakouts. That aparently is more consistant than the breakout follow through. However when you get that followthrough you better cover in a hurry because that is aparently a great way of catchign the big trends. Another area of difficulty for most traders is taking proffits to soon. the turtles accepted that they may see a 40% or greater drawdown PER POSITION while open before exiting. That trying to get smart and close the trades at the high will cost int he long run so they allow that much to be given back. Imagine a stock that is running balistically and then you can only exit on a 2 week new low. but with such a low batting average for a system it becomes imperative to let winners run their full course, exiting to soon exposes you to a "Slow death". Faith says that even back then they would encounter MONTHS of loosing trades on end. I know I'd have a hard time with that.
aparently that is the crux of "trend following" I thought I was trend following in simply buyng or selling in the direction fo the trend and working the trend... but aparently they define trend following as breakout trading and hanging on . I'm not shure it's for me... BUT the idea of trading agains the breakout does appeal to me. Or the Weinstein method of the point "C" breakout and pullback. But the Dochian breakouts don't apeal to me.
Things I did like was their position sizing and stop placement being a function of volitility. BUT I don't quite understand it. If anyone has the PCF's to do that or the formulas for working it in Excel I would greatly apreciate.
Also the trade exit methodology. I tend to exit way to soon... which is working out ok since my methods tend to produe a winn loss ratio of 1.75:1 or better my performance would improve allot If I adopted a cohesive plan for exiting trades. Not shure I like the 2 week low but I need to look into something.
I also like the way they increased their positions.. they did it much faster than I do. As the price is cruising up they start piling on positions such that on a momentum run they can be loaded with the max risk limit in a day or two. My methodology dosent do this..not that I've followed it through yet at all, being skittish in this market i'm in and out. BUT I wait for new entry types of setups and add on in decending quantities. I'm thinking of coming up with a way to maximize my position sooner. Perhaps this is a bad idea.
So how to focus on fading the breakout oportunities? What to look for?
|
|
Registered User
Joined: 2/13/2005
Posts: 368
|
Scott,
Would you mind sharing your scan that gave you the list of consolidating stocks (AKAM, AWI, BCO...STMP) I have several consolidating scans but I'd like to compare my thinking :
((MAXC80 - MINC80) / (.001 + MINC80)) * 100 >= 10 AND ((MAXC80.5 - MINC80.5) / (.001 + MINC80.5)) * 100 < 10 AND (C > MAXC80.5 AND (AVGV5 >= (1.5 * AVGV60.5))) (my consolidation breakout scan)
with your scan and I can learn something new. Thanks.
|
|
Registered User
Joined: 1/28/2005
Posts: 6,049
|
"So how to focus on fading the breakout oportunities? What to look for?"
--------------------------------------------------------------------
Realize that fading a breakout/breakdown is what is typically
know as overbought/oversold.
You are basically saying the trend is over rather than just starting.
Obviously it depends on what you are trying to do but price
resistance/support, volume/indicator divergence, oscillators
overbought/oversold are the tools typically used in this type
of trading.
Thanks
diceman
|
|
Registered User
Joined: 1/28/2005
Posts: 6,049
|
"Things I did like was their position sizing and stop placement being a function of volitility. BUT I don't quite understand it. If anyone has the PCF's to do that or the formulas for working it in Excel I would greatly apreciate."
-------------------------------------------------------------------------
Scott
I haven't read these books but have seen descriptions in reviews.
(so this could be wrong)
As I heard it they used a 20 period ATR to "size risk".
(1*ATR) for long trades and (2*ATR) for shorts.
---------------------------------------------------------------------------------
(ATR)
This is a 20 period ATR:
((AVGH20 - AVGL20) / 2 + (ABS(H - C1) + ABS(L - C1) + ABS(H1 - C2) + ABS(L1 - C2) + ABS(H2 - C3) + ABS(L2 - C3) + ABS(H3 - C4) + ABS(L3 - C4) + ABS(H4 - C5) + ABS(L4 - C5) + ABS(H5 - C6) + ABS(L5 - C6) + ABS(H6 - C7) + ABS(L6 - C7) + ABS(H7 - C8) + ABS(L7 - C8) + ABS(H8 - C9) + ABS(L8 - C9) + ABS(H9 - C10) + ABS(L9 - C10) + ABS(H10 - C11) + ABS(L10 - C11) + ABS(H11 - C12) + ABS(L11 - C12) + ABS(H12 - C13) + ABS(L12 - C13) + ABS(H13 - C14) + ABS(L13 - C14) + ABS(H14 - C15) + ABS(L14 - C15) + ABS(H15 - C16) + ABS(L15 - C16) + ABS(H16 - C17) + ABS(L16 - C17) + ABS(H17 - C18) + ABS(L17 - C18) + ABS(H18 - C19) + ABS(L18 - C19) + ABS(H19 - C20) + ABS(L19 - C20)) / 40 + .000001)
---------------------------------------------------------------------------------------
(RISK)
Lets say your account was $50,000 and you wanted to "take on"
1% risk. ($500)
This can be calculated by:
(50000*.01)/((AVGH20 - AVGL20) / 2 + (ABS(H - C1) + ABS(L - C1) + ABS(H1 - C2) + ABS(L1 - C2) + ABS(H2 - C3) + ABS(L2 - C3) + ABS(H3 - C4) + ABS(L3 - C4) + ABS(H4 - C5) + ABS(L4 - C5) + ABS(H5 - C6) + ABS(L5 - C6) + ABS(H6 - C7) + ABS(L6 - C7) + ABS(H7 - C8) + ABS(L7 - C8) + ABS(H8 - C9) + ABS(L8 - C9) + ABS(H9 - C10) + ABS(L9 - C10) + ABS(H10 - C11) + ABS(L10 - C11) + ABS(H11 - C12) + ABS(L11 - C12) + ABS(H12 - C13) + ABS(L12 - C13) + ABS(H13 - C14) + ABS(L13 - C14) + ABS(H14 - C15) + ABS(L14 - C15) + ABS(H15 - C16) + ABS(L15 - C16) + ABS(H16 - C17) + ABS(L16 - C17) + ABS(H17 - C18) + ABS(L17 - C18) + ABS(H18 - C19) + ABS(L18 - C19) + ABS(H19 - C20) + ABS(L19 - C20)) / 40 + .000001)
------------------------------------------------------------------------------------
Lets say you bought BA at the close.
These equations say that ATR is 1.87 and you can
buy 267.59 shares. (for $500 risk)
Since the close was 85.82 you would set your stop at
83.95. (fill price - 1*ATR)=(85.82-1.87)
(267 shares dropping 1.87 will be approx $500 risk.)
-------------------------------------------------------------------------
If you shorted BA at the close. You would short half
the share value (267.59*.5) or 133.795 shares.
So you would short 133 shares and place your stop
at 89.56 (fill price + 2*ATR)=(85.82+3.74)
Notice because you are taking twice the risk you
half the share value.
------------------------------------------------------------------
The (50000*.01) at the beginning of the equation is your
account size and risk. ($500 or 1% of 50,000).
If you wanted 2% of a 43000 account you would use
(43000*.02)
--------------------------------------------------------------------
Obviously you can adjust these to your needs.
This basic outline can be changed to whatever
is needed.
If you put the "RISK" equation in a watchlist tab and
C-(ATR). TC will tell you how many shares and your
approximate stop.
Thanks
diceman
|
|
Gold Customer
Joined: 10/7/2004
Posts: 264
|
Scott,
Linda Bradford Raskie and Larry Conners came up with their Turtle Soup setup. Google it for details. I'll need to look up the specific rules if you need them. The basic setup is to look for a 20 day breakout in which the prior 20 day breakout is 4 or more days prior. When that happens, you fade the move and take profits quickly. Good luck.
|
|
Registered User
Joined: 4/18/2005
Posts: 4,090
|
Diceman thanks for that... I those I posted a thanks earlier but it must have gotten dropped.
Thekubiaks: I"m basically only using one scan right now and have been for the last few months. though I"m building short scans now.
I've posted it before but here it goes again.
I prefer to find those periods of small to medium consolidation and enter as it ends. From there I view price as making a trampolene affect as it bounces out of the various moving averages I use ... each pullback into the range between the 20,30,50 ema's represents a potential buying area.
In a way this concept is historical volitility but the easier way to calculate it over longer periods is by measuring teh average spread between multiple moving averages.I use :
((ABS(XAVGC20 - XAVGC35) + ABS(XAVGC40 - XAVGC35) + ABS(XAVGC50 - XAVGC35)) / XAVGC35) * 100.
but you can change the period of emas to tighten or loosen it up. I find that this creates a nice cross section of oportunities.
Often times price will have just shot up and the EMA's havent reacted yet. Those could be breakouts and set aside to watch for a pullback. If you want to eliminate these I use Price % of the 20 EMA... just to trim the ones that no longer part of the consolidation.
100 * C / XAVGC20
Used in a scan both of the above will give slider bar options. The Price percent of the 20 thing im' not using now... in really bussy markets i'll pop it back in the scan. Set both to lower ranges but not to low onthe diceman formula above. Mine is set to a rank of 8 - 61 (list rank) This will catch some stuff that is still in an up trend... where this setup seems to realy shine. it also catches new bottoms.
I also have MS Xing up 25 day EMA and TSV24 crossing zero. They can be joined with an "AND" and plotted
XAVG(TSV,24) > 0 AND XAVG(TSV1.1,24) <= 0
MS > XAVG(MS,25) AND MS1.1 <= XAVG(MS1.1,25)
and volume greater than 100k for the last 20 days.
AVGV20 > 1000
I also plot (XAVGC20>XAVGC50)AND(XAVGC35>XAVGC50)AND(XAVGC50>XAVGC60) and scan for the first that is true and or use it as a confirmation for my holds.
watchlist is all stocks or all items.. what ever you prefer.
I would suggest Plotting the diceman as a custom indicaor and the TSV and MS thing joined togeather with an and and plotted as a % true and get a sense of what it pulls up..... it's not perfect obviously but it can lead to some pretty good things. THIS market is choppy and IMO care needs to be taken.... Pluss we seem to have an official down trend on now.... so that changes things. I've played bounces with this scan and I've played counter trends as well. Some times the picks are much better but right now no so much. There have been days where every holding I had was up on a down day for the markets through this.
The diceman version is a handy way to constrain certain criteria for trend characteristics. For instance
(H > H1 AND H1 > H2 AND H2 > H3) OR (H > H1 AND H1 <= H2 AND L1 >= L2 AND H2 > H3) OR (H <= H1 AND L >= L1 AND H1 > H2 AND H2 > H3) OR (H > H1 AND H1 > H2 AND H2 <= H3 AND L2 >= L3) AND C > C10 AND TSV18 < TSV18.3
Is a short pattern i'm tinkering with ... but not all signals are valid. I'd prefer to take it in a down trend OR a mall consolidaiton in a down trend or suspicious top. So scannign for this setup brings in a bit better than 50% chance of a good trade... BUT putting trend filters on and some larger context into play may make it more viable as a trading signal.
|
|
|
Guest-1 |