| Welcome Guest, please sign in to participate in a discussion. | Search | Active Topics | |
Registered User
Joined: 2/18/2008
Posts: 20
|
Note: I can't paste my chart into this posting. Please respond with an email so I can email you the chart I reference in this post! Thx.
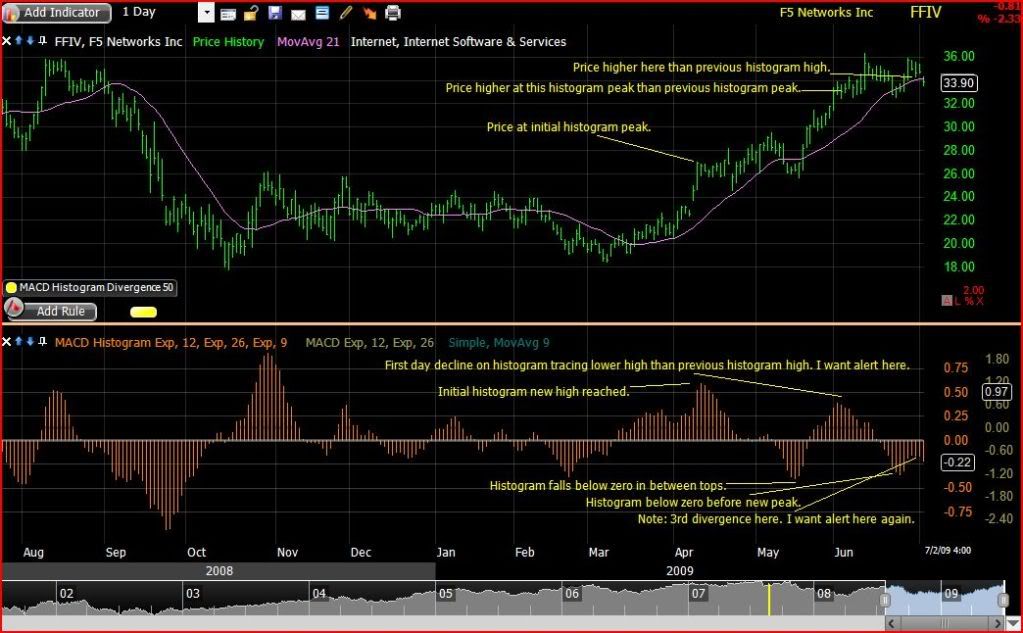
Greetings! I wonder if someone could email me a layout like this one with rules written to capture both bullish and bearish divergences on the exponential MACD histogram? I've labeled the following chart to show you the rule I would like to capture. In this case the chart is showing bearish divergences but I would also like to capture the inverse signal, a bullish divergence showing in a down trend.
In this chart as you notice in April prices hit a new high and MACD histogram traces a new high. In May prices level off and MACD histogram falls below zero for a time. In the beginning of June prices hit a new high and MACD histgram traces a new high but it is lower than the April high. This is my definition for a bearish divergence. I want an alert on the first day the MACD histogram declines creating this bearish divergence.
Also, at the end of June the MACD histogram traces another bearish divergence, this time the histogram did not make it up past zero. I would like an alert in this case also. If I can scan my watch list for this set up it would be most helpful.
Thanks for your help with this!
-Simon

|
|


Worden Trainer
Joined: 4/26/2007
Posts: 508
|
Hi spdudek,
If you'll check out julia.blocks.com, you'll find a post labelled 'Phoenix'. There's a Layout included there that is called 'Divergences'. Open that layout and see if that divergence rule works for you. You'll choose the period of time for the divergence. It's not perfect, but it's as close as I've come to a good first screening.
Let me know if you'd like the negative divergence rule created in the same way.
Best,
Julia
|
|
Registered User
Joined: 2/18/2008
Posts: 20
|
Hi Julia,
Thanks for your presentation in Phoenix!
I checked out the divergences layout and I'm not having any luck using it to screen exactly what I'm looking for. Is there a way I can email you a picture of the chart I've marked up?
Also, if what I'm looking to do with Stockfinder is more involved than you can address, can you recommend an advanced user or programmer I can pay to create the screens I want and then coach me on using the software?
Thanks for your help!
Simon
|
|
Worden Trainer
Joined: 4/26/2007
Posts: 508
|
spdudek,
If you want to share the chart you've marked up, I'll be happy to take a look and see what I can do. Otherwise, a general question posed in this forum is a great place to start. I don't have any specific recommendations for individuals who can train you or offer third-party code development. I can tell you that there are several people who regularly participate in these forums who provide great advice and insight.
Best,
Julia
|
|
Registered User
Joined: 2/18/2008
Posts: 20
|
Julia, Can you provide me with an email address or respond to (email removed by moderator). I'm not having any luck pasting my chart into this posting. Thanks. -Simon
|
|

Worden Trainer
Joined: 10/7/2004
Posts: 65,138
|
spdudek,
The best topic of which I am aware on posting images in the forums is Inserting A Chart into A Worden post.
Emails sent to a specific trainer's attention at support@worden.com will be forwarded, but customer training is not generally provided via email, phone or chat.
-Bruce
Personal Criteria Formulas
TC2000 Support Articles
|
|
Registered User
Joined: 2/18/2008
Posts: 20
|
|
|
Registered User
Joined: 2/18/2008
Posts: 20
|
Bruce, thank you for the instructions! That was a great help. So above is the behavior I'd like to capture along with the inverse bullish divergences. I'd like to be able to sort through a watchlist and have stockfinder locate stocks which on that particular day have just ticked down to form this pattern. Thanks for your help with this!
|
|
Worden Trainer
Joined: 10/7/2004
Posts: 65,138
|
spdudek,
Before we get to identifying diversions between Price and MACD-H at the local maxima (highs) and local minima (lows) of MACD-H, we need to have an unambiguous objective definition to identify the local extrema.
Using your chart and references to "first day decline on histogram" and "below zero before new peak", I settled upon an algorithm that keeps track of the top and bot(tom) as variables.
A local maxima is identified whenever the previous value of the histogram equals top and the current value of the histogram is below top.
Top is reset whenever the histogram equals bot while below zero.
A local minima is identified whenever the previous value of the histogram equals bot and the current value of the histogram is above bot.
Bot is reset whenever the histogram equals top while above zero.
While this does identify local maxima at the points mentioned on your chart, it also identifies additional local maxima that are not annotated.
What we need to go any further is a better definition of high and low that goes beyond both the example in your Thursday, July 16, 2009 10:36:26 AM ET post or an "I know when it see it" sort of description.
You should be able to Open the attached Chart directly into a running copy of StockFinder. It contains Rules to identify Highs and Lows based on the algorithm I described and also Plots the top and bot variables used in the algorithm in the Histogram Pane.Attachments:
MACD-H Top and Bot Example.sfChart - 83 KB, downloaded 1,042 time(s).
-Bruce
Personal Criteria Formulas
TC2000 Support Articles
|
|
Registered User
Joined: 1/11/2019
Posts: 28
|
Is this also applicable in TCV18? Please let me know.
|
|
Worden Trainer
Joined: 10/7/2004
Posts: 65,138
|
I do not know of any good way of implemented this type of algorithm in TC2000.
-Bruce
Personal Criteria Formulas
TC2000 Support Articles
|
|
|
Guest-1 |