| Welcome Guest, please sign in to participate in a discussion. | Search | Active Topics | |
Registered User
Joined: 6/15/2015
Posts: 49
|
Hello,
Is there a way to scan for stocks that are a within a certain percentage of their volatility stop?
For example, on the 30minute time frame, I'm looking for a stock that is trading above it's volatility stop to the long side. I've figured that part out. However, I'm looking for a way to make sure that it's trading no more than 3% above the most recent volatility stop on that timeframe.
Thank you.
|
|


Worden Trainer
Joined: 10/7/2004
Posts: 65,138
|
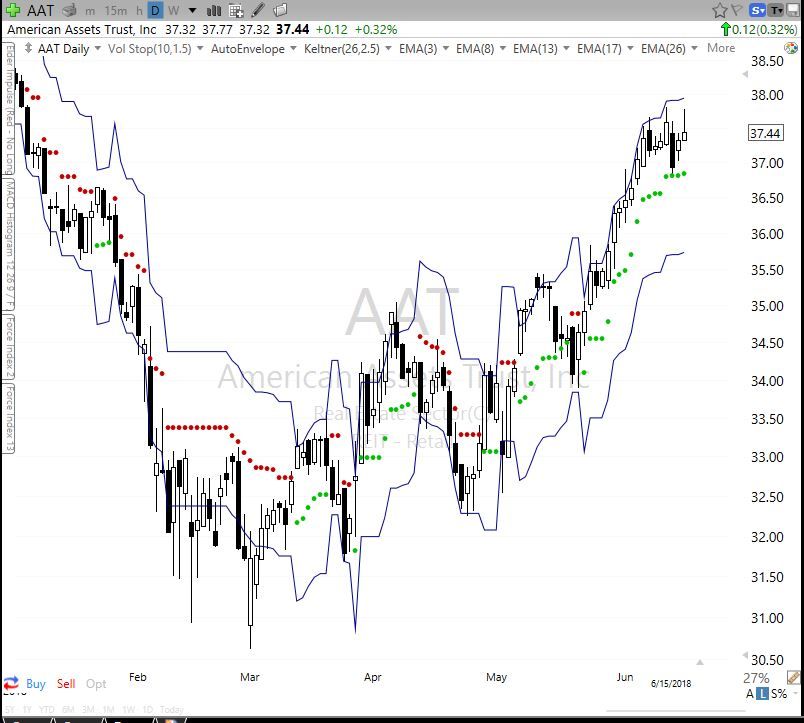
The only way I know of to do this is to add a 1 period envelope channel to the volatility stop indicator. You can then set the Width (%) setting to the desired percentage.
This allows you to create conditions for say price being below the top envelope channel and above the volatility stop and then use both of those conditions in the same scan.
-Bruce
Personal Criteria Formulas
TC2000 Support Articles
|
|

Registered User
Joined: 6/30/2017
Posts: 1,227
|
Nice. I can use this technique with my Doug Campbell setups. He turned me on to the VolStop. Cool.
|
|

Registered User
Joined: 6/30/2017
Posts: 1,227
|
Works like a charm. Thanks, Bruce!
The 3% mentioned above seems a little high, but of course, it's easy to adjust to your own preference ...

|
|
Registered User
Joined: 6/15/2015
Posts: 49
|
Al and Bruce,
Thank you for the help. Getting close to my desired results. Thanks again.
|
|

Registered User
Joined: 6/30/2017
Posts: 1,227
|
Happy to help. Good luck!
|
|
Registered User
Joined: 6/15/2015
Posts: 49
|
Hi Bruce,
Thank you for the help.
If I wanted to run a condition on a watchlist, how could I find out the following..
I'm looking to show how far the current price of a stock on the daily time frame is from the volatility stop. Any ideas?
As always, thank you for all of your help,
Patrick
|
|

Registered User
Joined: 6/30/2017
Posts: 1,227
|
Bruce will respond after he's parked the yacht, but ...
My caffeine-addled brain cells seem to recall the Volatility Stop isn't PCFable (it's a word - look it up) which might make calculating the distance from price to the Volatility Stop a challenge.
But if Bruce can think of a way, I could use it too. It would be nice to sort my watchlist of trending tickers by how close they are to their VolStop. All other things being equal, the closer price is to the VolStop, the lower risk the entry. Usually.
Bruce, can you make my day? :)
|
|


Worden Trainer
Joined: 10/7/2004
Posts: 65,138
|
Al_Gorithm is correct. I do not know of any way to calculate or create an indicator for the distance between price and the Volatility Stop.
The technique already described above is the only workaround I have for this and it doesn't seem like it will do what you want.
-Bruce
Personal Criteria Formulas
TC2000 Support Articles
|
|

Registered User
Joined: 6/30/2017
Posts: 1,227
|
I was correct?!?
Well, slap my a## and call me Sally.
Depending on how finely-grained you want to get with this you can set up multiple envelope channels, for example:
-
0.25%
-
0.50%
-
0.75%
-
1.00%
-
etc ...
I turn the opacity of the channel(s) all the way down. My eyes don't need to see them - they just clutter the price action on the chart. I just scan for the condition. So, ...
You could set up multiple conditions to group your watchlist into how close or how far your tickers are from the VolStop. That's the way I plan to do it, once I get my Gold service back next week. Long story; not important. :)
Enjoy, and good luck!
|
|
Registered User
Joined: 6/15/2015
Posts: 49
|
Thanks boys. Congrats on your yacht, Bruce.
|
|

Registered User
Joined: 6/30/2017
Posts: 1,227
|

|
|
|
Guest-1 |